
File:2009 USBC tenpin bowling pin carry study - probability of strike.svg

Size of this PNG preview of this SVG file: 800 × 450 pixels. Other resolutions: 320 × 180 pixels | 640 × 360 pixels | 1,024 × 576 pixels | 1,280 × 720 pixels | 2,560 × 1,440 pixels | 1,250 × 703 pixels.
Original file (SVG file, nominally 1,250 × 703 pixels, file size: 8 KB)
| This is a file from the Wikimedia Commons. Information from its description page there is shown below. Commons is a freely licensed media file repository. You can help. |
Summary
| Description |
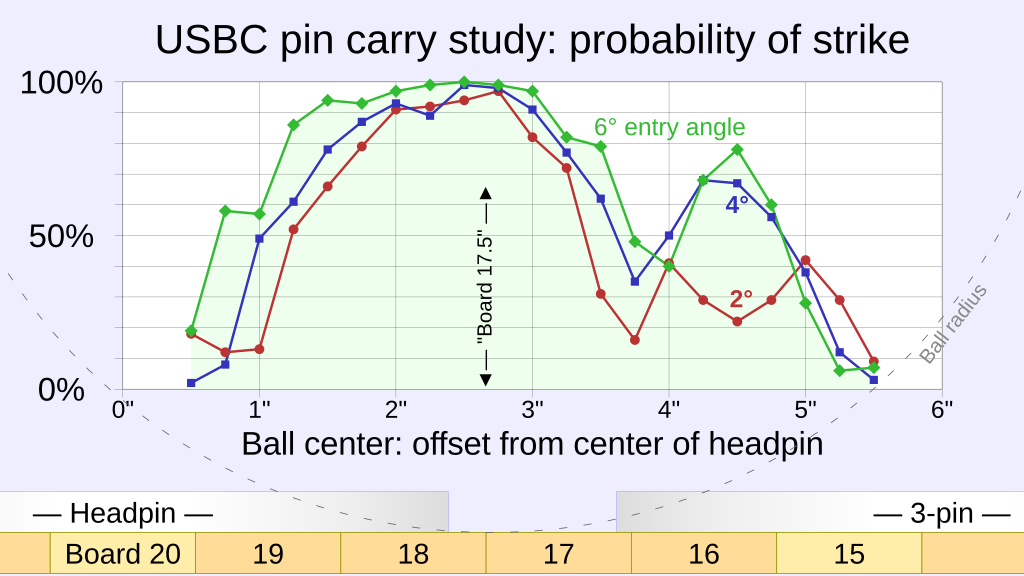
English: Line graphs showing probability of achieving a tenpin bowling strike as function of distance of ball impact from center of headpin, for different degrees of entry angle, based on 2009 USBC pin carry study
|
||
| Date | |||
| Source | Own work | ||
| Author | RCraig09 |
Related files
-
 20181230 Bowling ball at board 17.5 with pins.png
 -
 20200127 Bowling ball and pins for strike - front view.png
 -
 2009 USBC tenpin bowling pin carry study - probability of strike.svg


Licensing
I, the copyright holder of this work, hereby publish it under the following license:
This file is licensed under the Creative Commons Attribution-Share Alike 4.0 International license.
- You are free:
- to share – to copy, distribute and transmit the work
- to remix – to adapt the work
- Under the following conditions:
- attribution – You must give appropriate credit, provide a link to the license, and indicate if changes were made. You may do so in any reasonable manner, but not in any way that suggests the licensor endorses you or your use.
- share alike – If you remix, transform, or build upon the material, you must distribute your contributions under the same or compatible license as the original.
File history
Click on a date/time to view the file as it appeared at that time.
| Date/Time | Thumbnail | Dimensions | User | Comment | |
|---|---|---|---|---|---|
| current | 21:57, 17 November 2024 | | 1,250 × 703 (8 KB) | wikimediacommons>RCraig09 | Version 4: add red and blue colored areas for better definition |
File usage
The following page uses this file: