File:20201211 Billion dollar events related to climate change - U.S. -en.svg

Original file(SVG file, nominally 1,200 × 675 pixels, file size: 7 KB)

Summary

Description
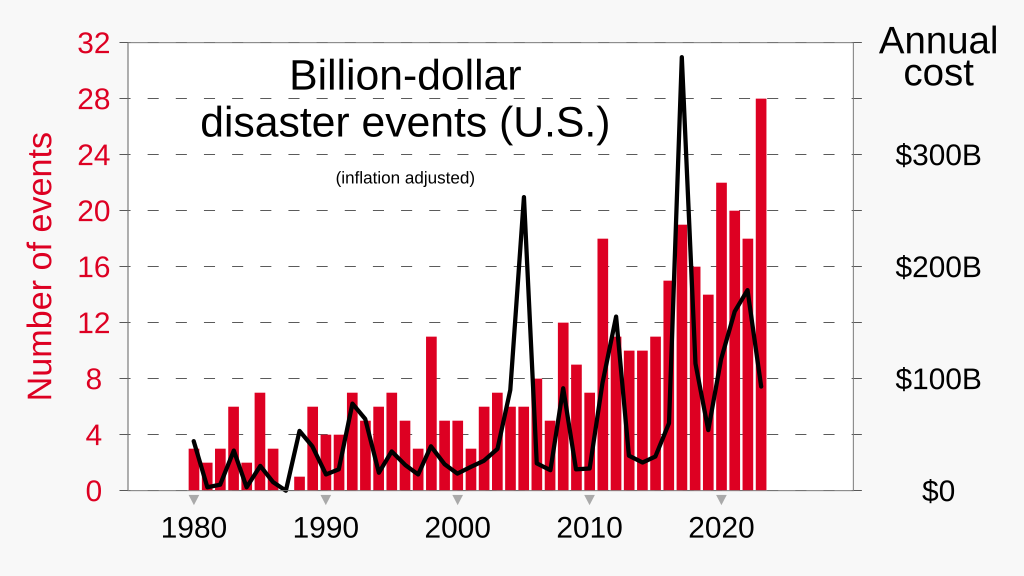
English: Graph of number billion-dollar climate-related events in the United States, and annual costs of those events, based on NOAA's National Centers for Environmental Information.
  • Relevant news event: "(Noaa) will no longer track the cost of climate crisis-fueled weather disasters, including floods, heatwaves, wildfires and more. It is the latest example of changes to the agency and the Trump administration limiting federal government resources on climate change." (The Guardian source, May 2025) and archive thereof)
  • Versions 10+ are updates through 2024.
Archive thereof: https://web.archive.org/web/20250202050919/https://www.ncei.noaa.gov/access/billions/time-series
  • Versions 8 and 9 are updates through 2023.
Archive thereof: https://web.archive.org/web/20240113044752/https://www.ncei.noaa.gov/access/billions/time-series/US
  • Version 6 is an update through 2022.
Archive thereof: https://web.archive.org/web/20221231055639/https://www.ncei.noaa.gov/access/billions/time-series
  • Version 4 is an update through 2021, with sources:
Archive thereof: https://web.archive.org/web/20220111143455/https://www.ncei.noaa.gov/news/calculating-cost-weather-and-climate-disasters
  • Most XML code for Version 4 was made by the Column Chart and Horizontal Bar Chart spreadsheets at User:RCraig09/Excel to XML for SVG. Earlier versions were made with Inkscape.
  • Version 2 is an update through end of 2020, with source:
  • Version 1 upload is based on data through September 2020, indicated by the "+" above 2020's bar in bar chart.


  • Downloaded data listing is provided below.
Date
Source Own work
Author RCraig09

Source data

Data through 2024.
Cost values for previous years change as successive years' data is added annually, presumably due to retroactive adjustments for inflation.

Click at right to show/hide data

Year _ Count _ Cost
1980 _ 3 _ 45.4
1981 _ 2 _ 3.5
1982 _ 3 _ 5.4
1983 _ 6 _ 36.3
1984 _ 2 _ 3.3
1985 _ 7 _ 22.5
1986 _ 3 _ 7.8
1987 _ 0 _ 0
1988 _ 1 _ 54.4
1989 _ 6 _ 40.3
1990 _ 4 _ 14.5
1991 _ 4 _ 19.6
1992 _ 7 _ 79.7
1993 _ 5 _ 65.7
1994 _ 6 _ 16.4
1995 _ 7 _ 35.5
1996 _ 5 _ 23.2
1997 _ 3 _ 15.1
1998 _ 11 _ 40.0
1999 _ 5 _ 24.4
2000 _ 5 _ 15.5
2001 _ 3 _ 21.8
2002 _ 6 _ 27.1
2003 _ 7 _ 38.3
2004 _ 6 _ 92.2
2005 _ 6 _ 267.0
2006 _ 8 _ 25.2
2007 _ 5 _ 18.8
2008 _ 12 _ 93.9
2009 _ 9 _ 19.8
2010 _ 7 _ 20.2
2011 _ 18 _ 97.9
2012 _ 11 _ 158.9
2013 _ 10 _ 32.1
2014 _ 10 _ 25.3
2015 _ 11 _ 30.9
2016 _ 15 _ 61.1
2017 _ 19 _ 395.7
2018 _ 16 _ 115.9
2019 _ 14 _ 55.4
2020 _ 22 _ 120.3
2021 _ 20 _ 164.2
2022 _ 18 _ 182.5
2023 _ 28 _ 95.1
2024 _ 27 _ 182.7


Licensing

I, the copyright holder of this work, hereby publish it under the following license:
w:en:Creative Commons
attribution share alike
This file is licensed under the Creative Commons Attribution-Share Alike 4.0 International license.
You are free:
  • to share – to copy, distribute and transmit the work
  • to remix – to adapt the work
Under the following conditions:
  • attribution – You must give appropriate credit, provide a link to the license, and indicate if changes were made. You may do so in any reasonable manner, but not in any way that suggests the licensor endorses you or your use.
  • share alike – If you remix, transform, or build upon the material, you must distribute your contributions under the same or compatible license as the original.

Captions

Graph of number billion-dollar climate-related events in the United States, and annual costs of those events, based on NOAA's National Centers for Environmental Information

Items portrayed in this file

depicts

12 December 2020

image/svg+xml

675 pixel

1,200 pixel

7,307 byte

267c47a2fa9657cd5134c57a4cf77892d02e21fc

File history

Click on a date/time to view the file as it appeared at that time.

Date/TimeThumbnailDimensionsUserComment
current12:38, 3 February 2025Thumbnail for version as of 12:38, 3 February 20251,200 × 675 (7 KB)wikimediacommons>RCraig09Version 15: Update to include figures for 2024 that were revised by NOAA, probably during January

Metadata