File:Bulle speculative phases.svg

Size of this PNG preview of this SVG file: 757 × 600 pixels. Other resolutions: 303 × 240 pixels | 606 × 480 pixels | 970 × 768 pixels | 1,280 × 1,014 pixels | 2,560 × 2,028 pixels | 876 × 694 pixels.
Original file (SVG file, nominally 876 × 694 pixels, file size: 13 KB)
| This is a file from the Wikimedia Commons. Information from its description page there is shown below. Commons is a freely licensed media file repository. You can help. |
Summary
| Description |
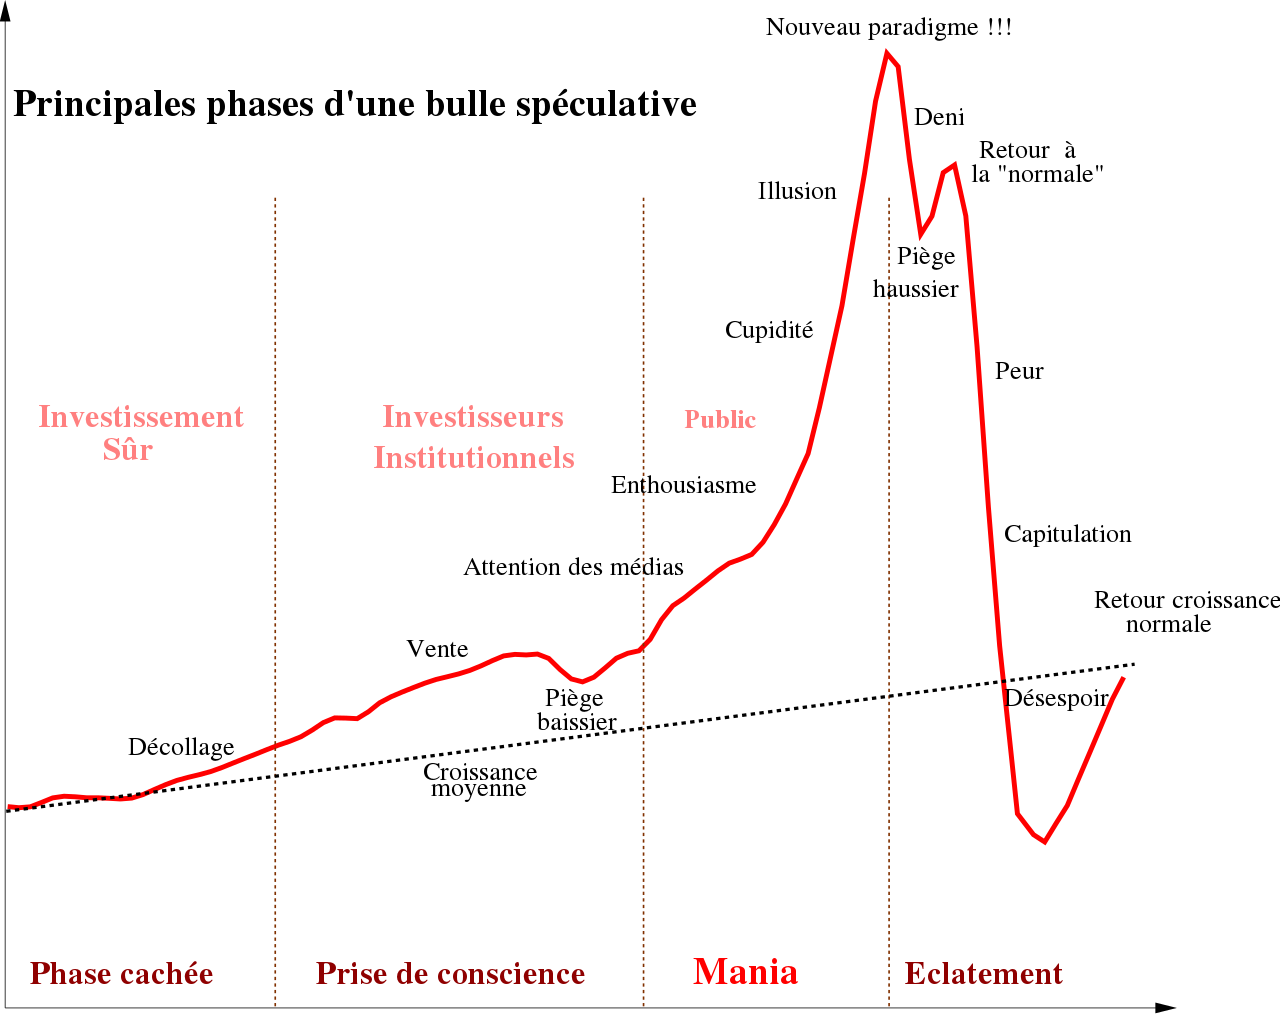
Français : Phases d'une bulle spéculative
English: Diagram of the typical phases of an economic bubble. It begins with a "takeoff" of prices in the "Hidden Stage", during which the asset is considered a "safe investment". In the second stage, "Awareness", there are "institutional investors" who make "sales" and go through a "bear trap". If "attention from the media" causes "enthusiasm", this brings about the "Mania" stage, which is marked by "public investors", a rapid increase in value, "greed" and "illusion" (of infinite growth). When the asset's value is very high, people declare this to be a "new paradigm!!!" Eventually the value declines, which is first met with "denial", but this is the start of the "Bubble Pop" stage. There is a "bull trap" with a brief re-increase of value which is considered "the return to 'normal'", only for further decline to trigger "fear", "mass selling" and finally "despair". The asset falls so far that it's worth less than it was before the bubble, but eventually "returns to normal growth". |
| Source | Own work |
| Author | Gandie |
| Other versions |
|
| SVG development | This vector image was created with an unknown SVG tool. This file uses embedded text that can be easily translated using a text editor. |

Licensing
I, the copyright holder of this work, hereby publish it under the following licenses:
This file is licensed under the Creative Commons Attribution-Share Alike 3.0 Unported license.
- You are free:
- to share – to copy, distribute and transmit the work
- to remix – to adapt the work
- Under the following conditions:
- attribution – You must give appropriate credit, provide a link to the license, and indicate if changes were made. You may do so in any reasonable manner, but not in any way that suggests the licensor endorses you or your use.
- share alike – If you remix, transform, or build upon the material, you must distribute your contributions under the same or compatible license as the original.

|
Permission is granted to copy, distribute and/or modify this document under the terms of the GNU Free Documentation License, Version 1.2 or any later version published by the Free Software Foundation; with no Invariant Sections, no Front-Cover Texts, and no Back-Cover Texts. A copy of the license is included in the section entitled GNU Free Documentation License. |
You may select the license of your choice.
File history
Click on a date/time to view the file as it appeared at that time.
| Date/Time | Thumbnail | Dimensions | User | Comment | |
|---|---|---|---|---|---|
| current | 16:26, 18 December 2019 | | 876 × 694 (13 KB) | wikimediacommons>-akko | cropping // Editing SVG source code using c:User:Rillke/SVGedit.js |
File usage
The following page uses this file: