
File:Chi-square cdf.svg

Size of this PNG preview of this SVG file: 600 × 400 pixels. Other resolutions: 320 × 213 pixels | 640 × 427 pixels | 1,024 × 683 pixels | 1,280 × 853 pixels | 2,560 × 1,707 pixels.
Original file (SVG file, nominally 600 × 400 pixels, file size: 20 KB)
| This is a file from the Wikimedia Commons. Information from its description page there is shown below. Commons is a freely licensed media file repository. You can help. |
Summary
| Description |
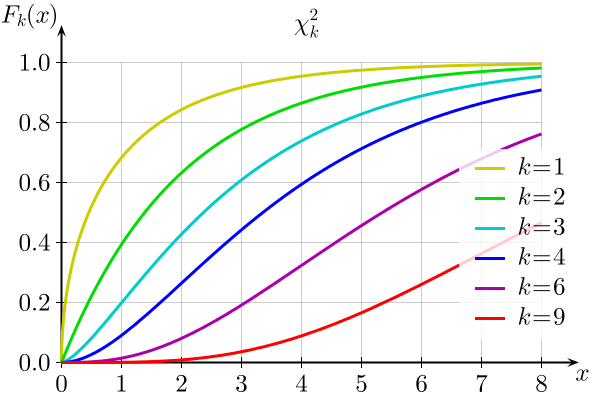
English: Plot of the cumulative chi-square distribution for values of k = {1, 2, 3, 4, 6, 9}. Accurate plotcurves. Labels are embedded in Computer-Modern font. |
| Date | |
| Source | Own work |
| Author | Geek3 |
| SVG development | This diagram was created with a text editor. |

| Description | Plot of the chi-square distribution |
|---|---|
| Equation | |
| Coordinate System | Cartesian |
| X Range | 0 .. 8 |
| Y Range | 0 .. 0.5 |
| Accuaracy | 0.00001 units |
See also
Licensing
I, the copyright holder of this work, hereby publish it under the following licenses:

|
Permission is granted to copy, distribute and/or modify this document under the terms of the GNU Free Documentation License, Version 1.2 or any later version published by the Free Software Foundation; with no Invariant Sections, no Front-Cover Texts, and no Back-Cover Texts. A copy of the license is included in the section entitled GNU Free Documentation License. |
This file is licensed under the Creative Commons Attribution 3.0 Unported license.
- You are free:
- to share – to copy, distribute and transmit the work
- to remix – to adapt the work
- Under the following conditions:
- attribution – You must give appropriate credit, provide a link to the license, and indicate if changes were made. You may do so in any reasonable manner, but not in any way that suggests the licensor endorses you or your use.
You may select the license of your choice.
File history
Click on a date/time to view the file as it appeared at that time.
| Date/Time | Thumbnail | Dimensions | User | Comment | |
|---|---|---|---|---|---|
| current | 11:38, 8 December 2014 | | 600 × 400 (20 KB) | wikimediacommons>IkamusumeFan | use tag ``none'' instead of ``transparent'' |
File usage
The following page uses this file: