File:DiffusionMicroMacro.gif
DiffusionMicroMacro.gif (360 × 300 pixels, file size: 402 KB, MIME type: image/gif, looped, 60 frames, 6.5 s)
| This is a file from the Wikimedia Commons. Information from its description page there is shown below. Commons is a freely licensed media file repository. You can help. |
Summary
| DescriptionDiffusionMicroMacro.gif |
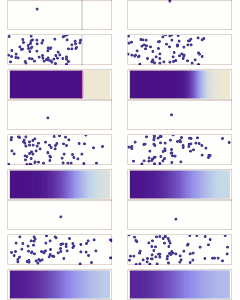
English: Diffusion from a microscopic and macroscopic point of view. Initially, there are solute molecules on the left side of a barrier (magenta line) and none on the right. The barrier is removed, and the solute diffuses to fill the whole container. Top: A single molecule moves around randomly. Middle: With more molecules, there is a clear trend where the solute fills the container more and more evenly. Bottom: With an enormous number of solute molecules, the randomness is gone: The solute appears to move smoothly and systematically from high-concentration areas to low-concentration areas, following Fick's laws.
Image is made in Mathematica, source code below. |
| Date | |
| Source | Own work |
| Author | Sbyrnes321 |
Licensing
| Public domainPublic domainfalsefalse |
| I, the copyright holder of this work, release this work into the public domain. This applies worldwide. In some countries this may not be legally possible; if so: I grant anyone the right to use this work for any purpose, without any conditions, unless such conditions are required by law. |
<< Mathematica source code >>
(* Source code written in Mathematica 6.0, by Steve Byrnes, 2010.
I release this code into the public domain. Sorry it's messy...email me any questions. *)

(*Particle simulation*)
SeedRandom[1];
NumParticles = 70;
xMax = 0.7;
yMax = 0.2;
xStartMax = 0.5;
StepDist = 0.04;
InitParticleCoordinates = Table[{RandomReal[{0, xStartMax}], RandomReal[{0, yMax}]}, {i, 1, NumParticles}];
StayInBoxX[x_] := If[x < 0, -x, If[x > xMax, 2 xMax - x, x]];
StayInBoxY[y_] := If[y < 0, -y, If[y > yMax, 2 yMax - y, y]];
StayInBoxXY[xy_] := {StayInBoxX[xy[[1]]], StayInBoxY[xy[[2]]]};
StayInBarX[x_] := If[x < 0, -x, If[x > xStartMax, 2 xStartMax - x, x]];
StayInBarY[y_] := If[y < 0, -y, If[y > yMax, 2 yMax - y, y]];
StayInBarXY[xy_] := {StayInBarX[xy[[1]]], StayInBarY[xy[[2]]]};
MoveAStep[xy_] := StayInBoxXY[xy + {RandomReal[{-StepDist, StepDist}], RandomReal[{-StepDist, StepDist}]}];
MoveAStepBar[xy_] := StayInBarXY[xy + {RandomReal[{-StepDist, StepDist}], RandomReal[{-StepDist, StepDist}]}];
NextParticleCoordinates[ParticleCoords_] := MoveAStep /@ ParticleCoords;
NextParticleCoordinatesBar[ParticleCoords_] := MoveAStepBar /@ ParticleCoords;
NumFramesBarrier = 10;
NumFramesNoBarrier = 50;
NumFrames = NumFramesBarrier + NumFramesNoBarrier;
ParticleCoordinatesTable = Table[0, {i, 1, NumFrames}];
ParticleCoordinatesTable[[1]] = InitParticleCoordinates;
For[i = 2, i <= NumFrames, i++,
  If[i <= NumFramesBarrier,
   ParticleCoordinatesTable[[i]] = NextParticleCoordinatesBar[ParticleCoordinatesTable[[i - 1]]],
   ParticleCoordinatesTable[[i]] = NextParticleCoordinates[ParticleCoordinatesTable[[i - 1]]]];];

(*Plot full particle simulation*)
makeplotbar[ParticleCoord_] :=
  ListPlot[{ParticleCoord, {{xStartMax, 0}, {xStartMax, yMax}}}, Frame -> True, Axes -> False,
   PlotRange -> {{0, xMax}, {0, yMax}}, Joined -> {False, True}, PlotStyle -> {PointSize[.03], Thick},
   AspectRatio -> yMax/xMax, FrameTicks -> None];

makeplot[ParticleCoord_] :=
 ListPlot[ParticleCoord, Frame -> True, Axes -> False, PlotRange -> {{0, xMax}, {0, yMax}}, Joined -> False,
  PlotStyle -> PointSize[.03], AspectRatio -> yMax/xMax, FrameTicks -> None]

ParticlesPlots =
  Join[Table[makeplotbar[ParticleCoordinatesTable[[i]]], {i, 1, NumFramesBarrier}],
   Table[makeplot[ParticleCoordinatesTable[[i]]], {i, NumFramesBarrier + 1, NumFrames}]];

(*Plot just the first particle in the list...Actually the fifth particle looks better. *)
FirstParticleTable = {#[[5]]} & /@ ParticleCoordinatesTable;

FirstParticlePlots =
  Join[Table[makeplotbar[FirstParticleTable[[i]]], {i, 1, NumFramesBarrier}],
   Table[makeplot[FirstParticleTable[[i]]], {i, NumFramesBarrier + 1, NumFrames}]];


(* Continuum solution *)

(* I can use the simple diffusion-on-an-infinite-line formula, as long as I correctly periodically replicate the
initial condition. Actually just computed nearest five replicas in each direction, that was a fine approximation. *)

(* k = diffusion coefficient, visually matched to simulation. *)
k = .0007;
u[x_, t_] := If[t == 0, If[x <= xStartMax, 1, 0], 1/2 Sum[
     Erf[(x - (-xStartMax + 2 n xMax))/Sqrt[4 k t]] - Erf[(x - (xStartMax + 2 n xMax))/Sqrt[4 k t]], {n, -5, 5}]];

ContinuumPlots = Join[
   Table[Show[
     DensityPlot[1 - u[x, 0], {x, 0, xMax}, {y, 0, yMax},
      ColorFunctionScaling -> False, AspectRatio -> yMax/xMax,
      FrameTicks -> None],
     ListPlot[{{xStartMax, 0}, {xStartMax, yMax}}, Joined -> True,
      PlotStyle -> {Thick, Purple}]],
    {i, 1, NumFramesBarrier}],
   Table[
    DensityPlot[1 - u[x, tt], {x, 0, xMax}, {y, 0, yMax},
     ColorFunctionScaling -> False, AspectRatio -> yMax/xMax,
     FrameTicks -> None],
    {tt, 1, NumFramesNoBarrier}]];

(*Combine and export *)

TogetherPlots =
  Table[GraphicsGrid[{{FirstParticlePlots[[i]]}, {ParticlesPlots[[i]]}, {ContinuumPlots[[i]]}},
   Spacings -> Scaled[0.2]], {i, 1, NumFrames}];

Export["test.gif", Join[TogetherPlots, Table[Graphics[], {i, 1, 5}]],
 "DisplayDurations" -> {10}, "AnimationRepititions" -> Infinity ]
Captions
Add a one-line explanation of what this file represents
ব্যাপন প্রক্রিয়া
Items portrayed in this file
depicts
16 January 2010
image/gif
File history
Click on a date/time to view the file as it appeared at that time.
| Date/Time | Thumbnail | Dimensions | User | Comment | |
|---|---|---|---|---|---|
| current | 14:41, 7 March 2012 |  | 360 × 300 (402 KB) | wikimediacommons>Dratini0 | Just removed the white last fram for aesthetic purposes, and prologed the display time of the last frame to mark the reatart of the animation. |
File usage
The following 4 pages use this file:
Retrieved from "https://enwiki.freddythechick.net/wiki/File:DiffusionMicroMacro.gif"


