
File:Fisher iris versicolor sepalwidth.svg

Size of this PNG preview of this SVG file: 800 × 552 pixels. Other resolutions: 320 × 221 pixels | 640 × 441 pixels | 1,024 × 706 pixels | 1,280 × 883 pixels | 2,560 × 1,766 pixels | 822 × 567 pixels.
Original file (SVG file, nominally 822 × 567 pixels, file size: 17 KB)
| This is a file from the Wikimedia Commons. Information from its description page there is shown below. Commons is a freely licensed media file repository. You can help. |
Summary
| Description |
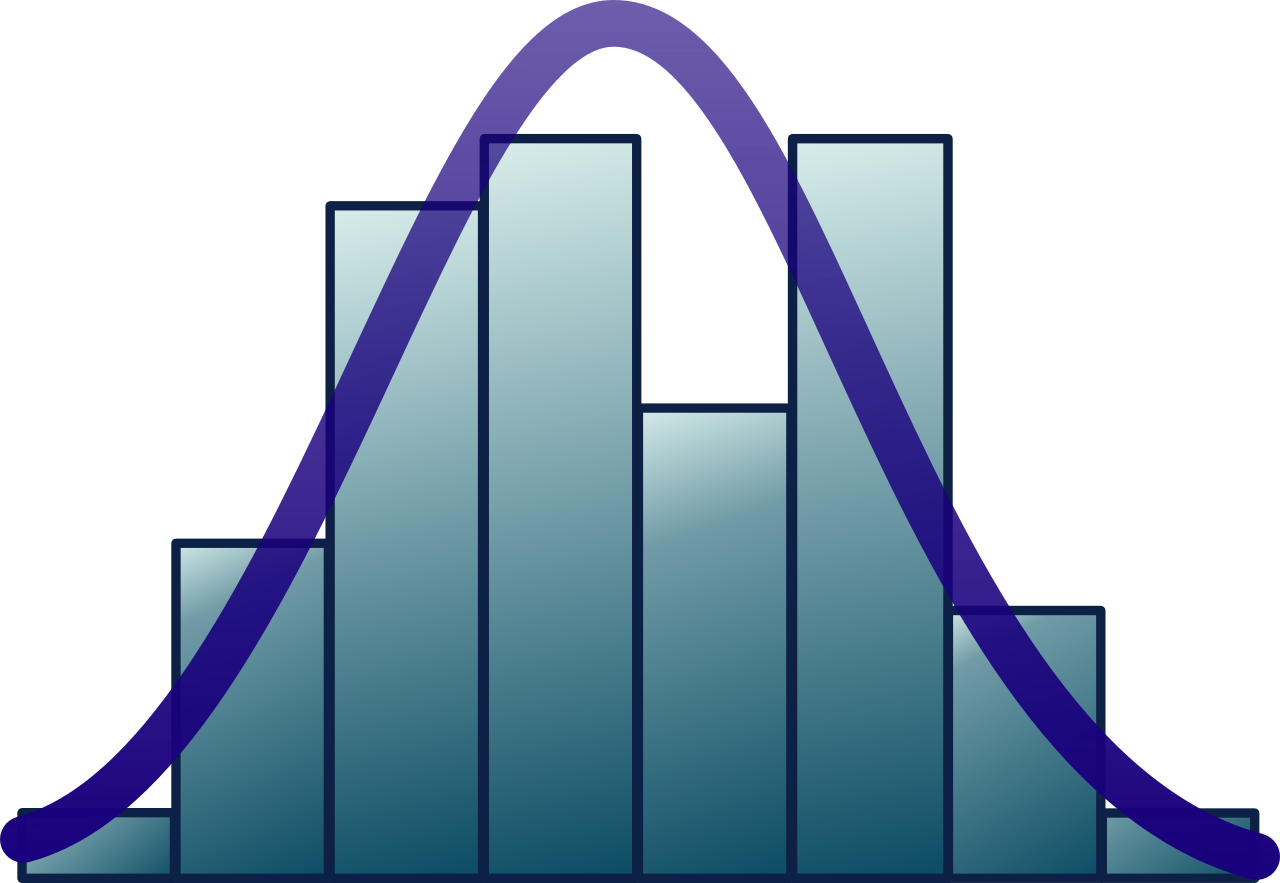
English: Histogram of sepal widths for Iris versicolor from Fisher's Iris flower data set. SVG redraw of original image. |
| Date | (UTC) |
| Source | en:Image:Fisher iris versicolor sepalwidth.png |
| Author | en:User:Qwfp (original); Pbroks13 (talk) (redraw) |
Licensing
This file is licensed under the Creative Commons Attribution-Share Alike 3.0 Unported license.
- You are free:
- to share – to copy, distribute and transmit the work
- to remix – to adapt the work
- Under the following conditions:
- attribution – You must give appropriate credit, provide a link to the license, and indicate if changes were made. You may do so in any reasonable manner, but not in any way that suggests the licensor endorses you or your use.
- share alike – If you remix, transform, or build upon the material, you must distribute your contributions under the same or compatible license as the original.
File history
Click on a date/time to view the file as it appeared at that time.
| Date/Time | Thumbnail | Dimensions | User | Comment | |
|---|---|---|---|---|---|
| current | 09:40, 7 April 2013 | | 822 × 567 (17 KB) | wikimediacommons>Scarce2 | last try |
File usage
More than 100 pages use this file. The following list shows the first 100 pages that use this file only. A full list is available.
- Abundance estimation
- Accuracy paradox
- Andrews plot
- Artificial precision
- Association of Statisticians of American Religious Bodies
- Average daily rate
- Backus–Gilbert method
- Bayes error rate
- Bayesian survival analysis
- Bellman filter
- Box's M test
- Box–Cox distribution
- Chernoff's distribution
- Church of Scotland Yearbook
- Component analysis (statistics)
- Consecutive sampling
- Eastern and Midland Region
- Ecological regression
- Error bar
- Evidential decision theory
- FISIM
- Frequentist inference
- Geary's C
- Generalized Wiener process
- Glossary of probability and statistics
- Group family
- Hellin's law
- Identity line
- Impartial culture
- Information source (mathematics)
- Intra-rater reliability
- Iterated conditional modes
- Jeans's theorem
- Judgment sample
- Kish grid
- L-statistic
- Lexis diagram
- List of statisticians
- Lorenz asymmetry coefficient
- Manipulation check
- Morisita's overlap index
- Nemenyi test
- Normal-exponential-gamma distribution
- Normal distribution
- Northern and Western Region
- Notation in probability and statistics
- OpenIntro Statistics
- Orthogonal signal correction
- Owen's T function
- PRESS statistic
- Parallel analysis
- Parity plot
- Pooled analysis
- Population study
- Portmanteau test
- Principal geodesic analysis
- Principal response curve
- Proxy (statistics)
- Random modulation
- Rate ratio
- Rational quadratic covariance function
- Rayleigh test
- Regression control chart
- Repeated median regression
- Researcher degrees of freedom
- Respondent error
- Root mean square deviation
- SCORUS
- Sheppard's correction
- Shrinkage (statistics)
- Size (statistics)
- Standard normal deviate
- Statistical assembly
- Statisticians in the Pharmaceutical Industry
- Stimulus–response model
- Streamgraph
- Strong and weak sampling
- Symbolic data analysis
- Tampering (quality control)
- Targeted projection pursuit
- The Tiger That Isn't
- Tucker decomposition
- Two-sample hypothesis testing
- Tyranny of averages
- University Statisticians of the Southern Experiment Stations
- Variational series
- Varimax rotation
- W-test
- Watanabe–Akaike information criterion
- English Wikipedia @ Freddythechick:WikiProject Statistics/sidebar
- Template:Portal/doc/all
- Template:Statistics topics sidebar
- Template:Stats banner
- Template:Stats banner/doc
- Template:User WP Statistics/doc
- Template:User WikiProject Statistics
- Template:User interest statistics/doc
- Template:WikiProject Statistics/sandbox
- Category:Statistician stubs
- Category:Statistics articles needing expert attention
View more links to this file.