
File:Foucault pendulum precession vs latitude.svg

Size of this PNG preview of this SVG file: 512 × 297 pixels. Other resolutions: 320 × 186 pixels | 640 × 371 pixels | 1,024 × 594 pixels | 1,280 × 743 pixels | 2,560 × 1,485 pixels.
Original file (SVG file, nominally 512 × 297 pixels, file size: 48 KB)
| This is a file from the Wikimedia Commons. Information from its description page there is shown below. Commons is a freely licensed media file repository. You can help. |
Summary
| Description |
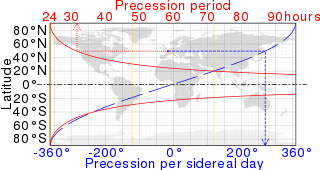
English: Graphs of precession period and precession per sidereal day vs latitude. The sign changes as a Foucault pendulum rotates anticlockwise in the Southern Hemisphere and clockwise in the Northern Hemisphere. The example shows that one in Paris precesses 271° each sidereal day, taking 31.8 hours per rotation. The background map is from http://commons.wikimedia.org/wiki/File:BlankMap-World6-Equirectangular.svg . |
|
| Date | ||
| Source |
|
|
| Author | cmglee, John Harvey et al |
Licensing
This file is licensed under the Creative Commons Attribution-Share Alike 4.0 International license.
- You are free:
- to share – to copy, distribute and transmit the work
- to remix – to adapt the work
- Under the following conditions:
- attribution – You must give appropriate credit, provide a link to the license, and indicate if changes were made. You may do so in any reasonable manner, but not in any way that suggests the licensor endorses you or your use.
- share alike – If you remix, transform, or build upon the material, you must distribute your contributions under the same or compatible license as the original.
File history
Click on a date/time to view the file as it appeared at that time.
| Date/Time | Thumbnail | Dimensions | User | Comment | |
|---|---|---|---|---|---|
| current | 07:28, 24 December 2024 | | 512 × 297 (48 KB) | wikimediacommons>Mikhail Ryazanov | hyphens → minuses; avoid overlapping text |
File usage
The following page uses this file: