
File:Global Temperature Anomaly.svg

Size of this PNG preview of this SVG file: 800 × 556 pixels. Other resolutions: 320 × 222 pixels | 640 × 444 pixels | 1,024 × 711 pixels | 1,280 × 889 pixels | 2,560 × 1,778 pixels | 1,440 × 1,000 pixels.
Original file (SVG file, nominally 1,440 × 1,000 pixels, file size: 28 KB)
| This is a file from the Wikimedia Commons. Information from its description page there is shown below. Commons is a freely licensed media file repository. You can help. |
Summary
| Description |
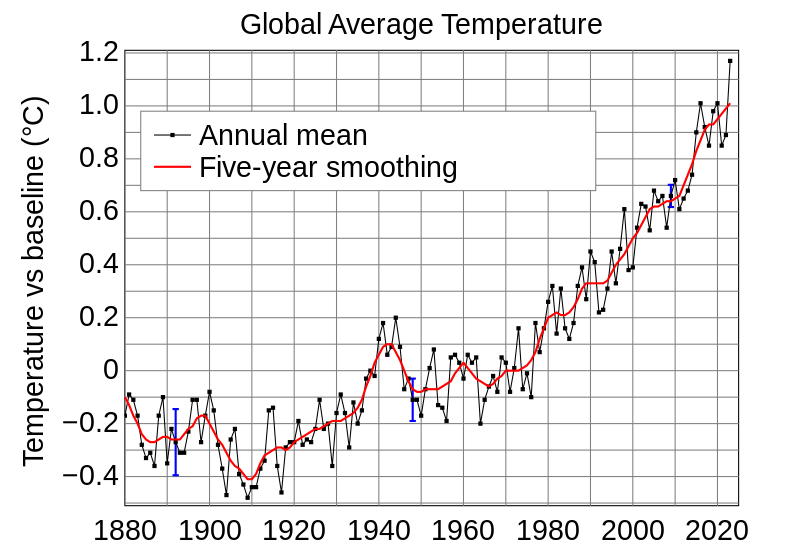
English: Land-ocean temperature index, 1880 to present, with base period 1951-1980. The solid black line is the global annual mean and the solid red line is the five-year lowess smooth. The blue uncertainty bars represents the total (LSAT and SST) annual uncertainty at a 95% confidence interval. [More information on the updated uncertainty model can be found here: Lenssen et al. (2019).]
The following translations are not updated: Čeština: Čárový graf globálního průměrného teplotního indexu Země-oceán, od roku 1880 do současnosti, k základnímu období 1951-1980. Černá čára je roční průměr a červená čára je pětiletý klouzavý průměr. [Toto je aktualizace Obr. 1A v Hansen et al. (2006).] Graf ukazuje celkový dlouhodobý trend oteplování dlouhodobý trend oteplování.
Español: Índice de la temperatura media global, desde 1880 hasta la actualidad, con el período base 1951-1980. La línea negra sólida es la media global anual y la línea roja sólida es una curva suavizada con una regresión local no paramétrica basada en un modelo k vecino más cercano. La función se evalúa utilizando una parte de los datos correspondiente a un rango de diez años de datos, lo que resulta en un suavizado en la práctica de aproximadamente cinco años. Las barras azules representan la incertidumbre (límite de confianza del 95%) para el caso de observaciones espaciales incompletas. Esto se basa en la Fig. 1A en Hansen et al. (2006) y la Fig. 9a en Hansen et al. (2010). Gráfico actualizado con datos hasta 2016 procedentes de https://data.giss.nasa.gov/gistemp/graphs/. El gráfico muestra una tendencia global de calentamiento a largo plazo. |
||
| Date | |||
| Source | https://data.giss.nasa.gov/gistemp/graphs_v4/ | ||
| Author | NASA Goddard Institute for Space Studies, changed | ||
| Other versions |
Derivative works of this file: Globalni teplotni odchylka cs.svg (czech) Derivative works of this file: Temperature Anomaly 1880-now NL.svg (dutch) |
||
| SVG development | This chart was created with an unknown SVG tool. This chart is translated using SVG switch elements: all translations are stored in the same file. | ||
| Source code | SVG code
|
Licensing
| This file is in the public domain in the United States because it was solely created by NASA. NASA copyright policy states that "NASA material is not protected by copyright unless noted". (See Template:PD-USGov, NASA copyright policy page or JPL Image Use Policy.) | ||
 |
Warnings:
|
File history
Click on a date/time to view the file as it appeared at that time.
| Date/Time | Thumbnail | Dimensions | User | Comment | |
|---|---|---|---|---|---|
| current | 00:51, 29 January 2024 | | 1,440 × 1,000 (28 KB) | wikimediacommons>Habitator terrae | updated // Editing SVG source code using c:User:Rillke/SVGedit.js |
File usage
The following 8 pages use this file: