
File:How superheterodyne receiver works.svg

Size of this PNG preview of this SVG file: 597 × 600 pixels. Other resolutions: 239 × 240 pixels | 478 × 480 pixels | 764 × 768 pixels | 1,019 × 1,024 pixels | 2,038 × 2,048 pixels | 1,020 × 1,025 pixels.
Original file (SVG file, nominally 1,020 × 1,025 pixels, file size: 38 KB)
| This is a file from the Wikimedia Commons. Information from its description page there is shown below. Commons is a freely licensed media file repository. You can help. |
Summary
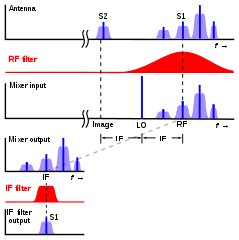
| Description |
English: Graphs showing how a superheterodyne| radio receiver works. All the graphs horizontal axis is frequency f. The blue graphs represent signal strength (voltage) at various point in the circuit. The red graphs are the transfer functions of the filters; the width of the red band represents the fraction of the signal from the graph above it that passes through the filter at various frequencies. The top graph shows the voltage from the antenna applied to the receiver. It is a composite of signals (blue shapes) from several radio transmitters at different frequencies. Signal S1 is the signal received by the radio. Each signal consists of the carrier frequency (dark blue vertical line) with sidebands on either side containing the modulation (light blue bands). The signal first passes through the RF filter. Its purpose is to remove any signal such as S2 at the image frequency, LO - IF, which would otherwise interfere with the received signal. The 3rd graph shows the signals applied to the mixer, consisting of the local oscillator signal LO and the four radio signals. In the mixer the LO signal beats with the four signals, creating heterodynes at the difference between the signal frequency and the LO frequency. The 4th graph shows these heterodynes. The IF filter (5th graph) selects the frequency of the desired signal, S1 and filters out the others, along with unwanted modulation products
Русский: Преобразование частоты в супергетеродинном приёмнике |
| Date | |
| Source | Own work |
| Author | Chetvorno |
| Other versions |
|
| SVG development | This diagram was created with Inkscape, or with something else. This diagram uses translateable embedded text. |


Licensing
I, the copyright holder of this work, hereby publish it under the following license:
| This file is made available under the Creative Commons CC0 1.0 Universal Public Domain Dedication. | |
| The person who associated a work with this deed has dedicated the work to the public domain by waiving all of their rights to the work worldwide under copyright law, including all related and neighboring rights, to the extent allowed by law. You can copy, modify, distribute and perform the work, even for commercial purposes, all without asking permission.
|
File history
Click on a date/time to view the file as it appeared at that time.
| Date/Time | Thumbnail | Dimensions | User | Comment | |
|---|---|---|---|---|---|
| current | 16:39, 9 May 2017 | | 1,020 × 1,025 (38 KB) | wikimediacommons>Chetvorno | Replaced invalid Inkscape SVG version with "plain SVG" version which passes validation |
File usage
The following page uses this file: