
File:Involutes of a cubic curve.svg

Size of this PNG preview of this SVG file: 600 × 600 pixels. Other resolutions: 240 × 240 pixels | 480 × 480 pixels | 768 × 768 pixels | 1,024 × 1,024 pixels | 2,048 × 2,048 pixels | 1,440 × 1,440 pixels.
Original file (SVG file, nominally 1,440 × 1,440 pixels, file size: 59 KB)
| This is a file from the Wikimedia Commons. Information from its description page there is shown below. Commons is a freely licensed media file repository. You can help. |
Summary
| Description |
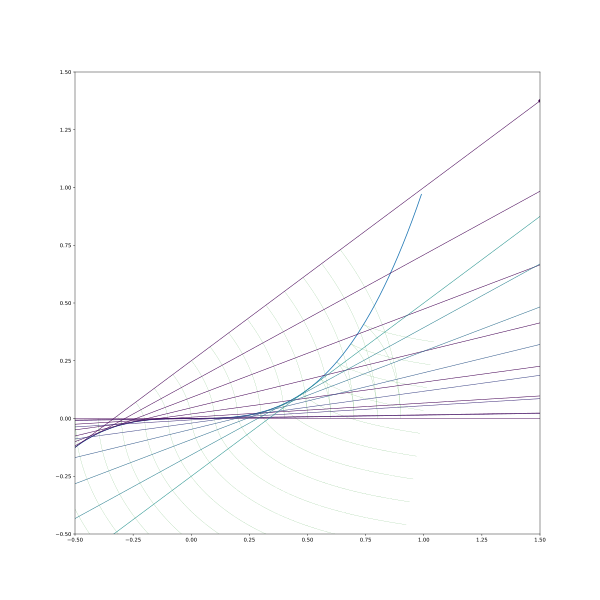
English: Desc
Python codeimport numpy as np
import matplotlib.pyplot as plt
from scipy.integrate import quad # numerical integration
import matplotlib.cm as cm # for colormaps
def involute(f, df, x0, l0, dxs):
"""
f: the function that produces the curve
df: the derivative. That is, df(x) = f'(x)
x0: the origin point
l0: the string length at origin point
dxs: the differential points at which to plot the involute.
Assumed to be sorted in increasing order
returns f_xs, f_ys, inv_xs, inv_ys
"""
f_xs = x0 + dxs
f_ys = f(f_xs)
inv_xs = np.zeros(len(dxs))
inv_ys = np.zeros(len(dxs))
arclength_integrand = lambda x: np.sqrt(1 + df(x)**2)
for i in range(len(dxs)):
x = x0 + dxs[i]
arclength = quad(arclength_integrand, x0, x)[0]
string_length = l0 - arclength
string_angle = np.arctan(df(x))
inv_xs[i] = f_xs[i] + string_length * np.cos(string_angle)
inv_ys[i] = f_ys[i] + string_length * np.sin(string_angle)
return f_xs, f_ys, inv_xs, inv_ys
def plot_line(x, y, slope, dxmin, dxmax, **kwargs):
plt.plot([x+dxmin, x+dxmax], [y+dxmin*slope, y+dxmax*slope],
**kwargs)
f = lambda x: x**3
df = lambda x: 3 * x**2
f_xs, f_ys, inv_xs, inv_ys = involute(f, df, 0, l0=0.8, dxs=np.arange(200) / 100 - 1)
y_x_ratio = 1
plt.figure(figsize=(16, int(16*y_x_ratio)))
plt.plot(f_xs, f_ys)
for l0 in np.arange(20)/10-1:
f_xs, f_ys, inv_xs, inv_ys = involute(f, df, 0, l0=l0, dxs=np.arange(200) / 100 - 0.5)
plt.plot(inv_xs, inv_ys, color='green', linewidth=0.2)
for x in np.linspace(-0.5, 0.5, 15):
y = f(x)
slope = df(x)
plot_line(x, y, slope, -1, +2, color=cm.viridis(x), marker='o',markersize=5, linewidth=1)
xlim_low = -0.5
xlim_width = 2
ylim_low = -0.5
plt.xlim(xlim_low, xlim_low + xlim_width)
plt.ylim(ylim_low, ylim_low + xlim_width * y_x_ratio)
plt.savefig("involutes of a cubic curve.svg")
plt.show()
|
| Date | |
| Source | Own work |
| Author | Cosmia Nebula |
Licensing
I, the copyright holder of this work, hereby publish it under the following license:
This file is licensed under the Creative Commons Attribution-Share Alike 4.0 International license.
- You are free:
- to share – to copy, distribute and transmit the work
- to remix – to adapt the work
- Under the following conditions:
- attribution – You must give appropriate credit, provide a link to the license, and indicate if changes were made. You may do so in any reasonable manner, but not in any way that suggests the licensor endorses you or your use.
- share alike – If you remix, transform, or build upon the material, you must distribute your contributions under the same or compatible license as the original.
File history
Click on a date/time to view the file as it appeared at that time.
| Date/Time | Thumbnail | Dimensions | User | Comment | |
|---|---|---|---|---|---|
| current | 07:07, 4 September 2023 | | 1,440 × 1,440 (59 KB) | wikimediacommons>Cosmia Nebula | Uploaded while editing "Involute" on en.wikipedia.org |
File usage
The following page uses this file: