
File:Mangoldt-series.svg

Size of this PNG preview of this SVG file: 600 × 480 pixels. Other resolutions: 300 × 240 pixels | 960 × 768 pixels | 1,280 × 1,024 pixels | 2,560 × 2,048 pixels.
Original file (SVG file, nominally 600 × 480 pixels, file size: 13 KB)
| This is a file from the Wikimedia Commons. Information from its description page there is shown below. Commons is a freely licensed media file repository. You can help. |
Summary
| Description |
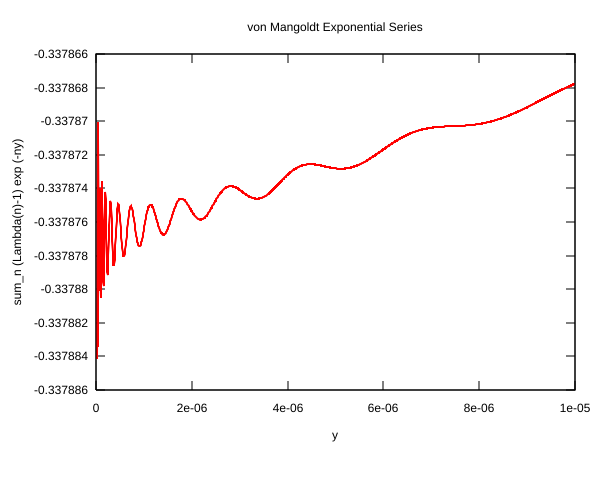
English: Graph of a series involving the von Mangoldt function. More precisely, this is a graph of the function
considered by Hardy and Littlewood in 1916. They demonstrated that Curiously, they also show that this function is oscillatory as well, with diverging oscillations. In particular, there exists a value such that
|
| Date | 3 July 2006; 4 July 2006 (original upload date) |
| Source | Own work |
| Author | Linas Vepstas (User:Linas) |


Licensing

|
Permission is granted to copy, distribute and/or modify this document under the terms of the GNU Free Documentation License, Version 1.2 or any later version published by the Free Software Foundation; with no Invariant Sections, no Front-Cover Texts, and no Back-Cover Texts. A copy of the license is included in the section entitled GNU Free Documentation License. |
| This file is licensed under the Creative Commons Attribution-Share Alike 3.0 Unported license. | ||
| ||
| This licensing tag was added to this file as part of the GFDL licensing update. |
Original upload log
Transferred from en.wikipedia to Commons using For the Common Good.
The original description page was here. All following user names refer to en.wikipedia.
| Date/Time | Dimensions | User | Comment |
|---|---|---|---|
| 15:19, 4 July 2006 | 600 × 480 (12,300 bytes) | w:en:Linas (talk | contribs) | higher precision, 2 billion terms |
| 04:40, 4 July 2006 | 600 × 480 (9,078 bytes) | w:en:Linas (talk | contribs) | oops, its upside-down |
| 04:14, 4 July 2006 | 600 × 480 (9,080 bytes) | w:en:Linas (talk | contribs) | Graph of a series involving the [[von Mangoldt function]]. Created by Linas Vepstas [[User:Linas]] on 3 July 2006 |
File history
Click on a date/time to view the file as it appeared at that time.
| Date/Time | Thumbnail | Dimensions | User | Comment | |
|---|---|---|---|---|---|
| current | 18:40, 25 October 2015 | | 600 × 480 (13 KB) | wikimediacommons>Pqnlrn | Reverted to version as of 18:30, 2 November 2013 (UTC) |
File usage
The following page uses this file: