
File:Number of prokaryotic genomes and sequencing costs.svg

Size of this PNG preview of this SVG file: 800 × 533 pixels. Other resolutions: 320 × 213 pixels | 640 × 427 pixels | 1,024 × 683 pixels | 1,280 × 853 pixels | 2,560 × 1,707 pixels | 1,350 × 900 pixels.
Original file (SVG file, nominally 1,350 × 900 pixels, file size: 145 KB)
| This is a file from the Wikimedia Commons. Information from its description page there is shown below. Commons is a freely licensed media file repository. You can help. |
Summary
| Description |
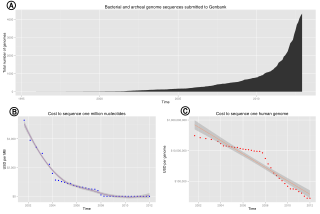
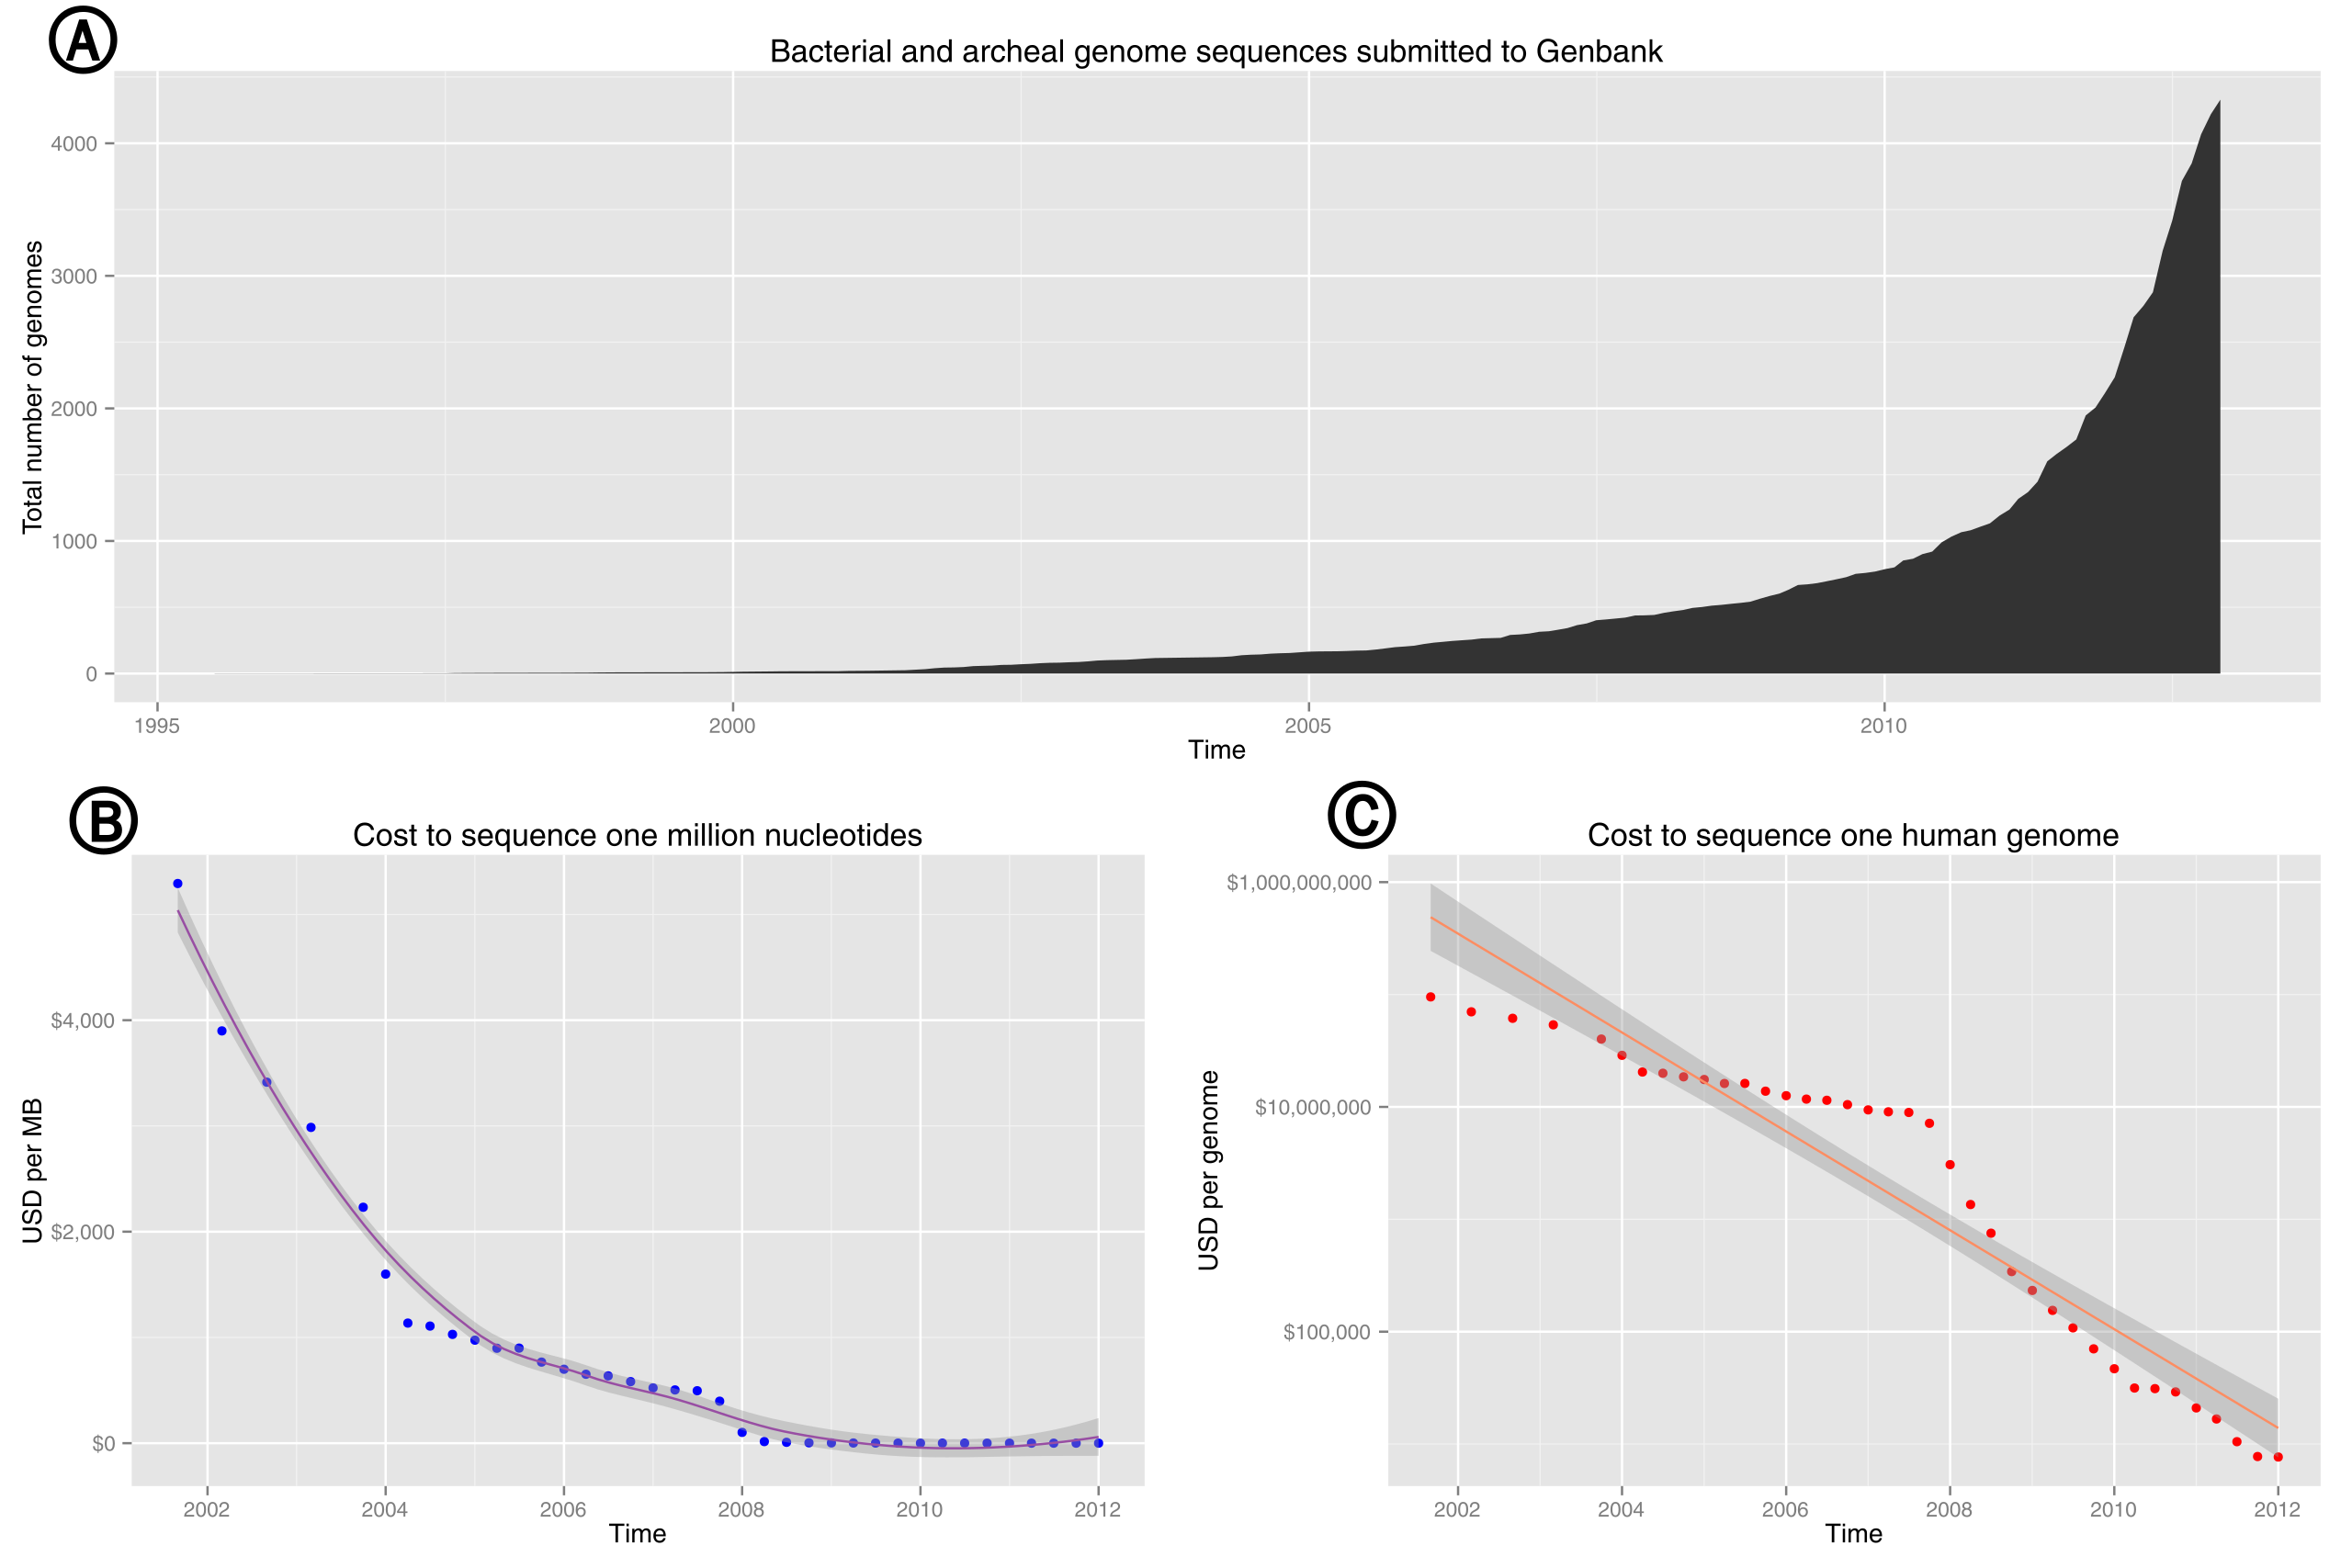
English: Plot of the total number of prokaryotic genomes submitted to Genbank as a function of time. Based on data from genome reports and genome.gov. Subfigures: (A) Exponential growth of genome sequence databases since 1995. (B) The cost in US Dollars (USD) to sequence one million bases. (C) The cost in USD to sequence a 3,000 Mb (human-sized) genome on a log10 transformed scale. |
| Date | |
| Source | Own work |
| Author | Estevezj |
| Other versions |
This file was derived from: Bacterial and archeal genome sequences submitted to Genbank.svg: |
| SVG development | |
| Source code | R code# Download our tables from NCBI's FTP site. Accessed 14:30PST, 18 December 2012
prok <- read.table("ftp://ftp.ncbi.nlm.nih.gov/genomes/GENOME_REPORTS/prokaryotes.txt", sep="\t", comment.char="!", header=T)
# Pull release dates, while dropping rows lacking a release date.
prok <- as.Date(prok$Release.Date[prok$Release.Date != '-'],format="%Y/%m/%d")
# Bin our dates by month and year, tabulate, and save to a dataframe.
prok.cut <- as.data.frame(
table(
as.Date(
cut(prok, "month")
)
)
)
# Correct our column titles, calculate a running total, and reconvert from factor to date
colnames(prok.cut) <- c("Date", "Total")
prok.cut$Total <- cumsum(prok.cut$Total)
prok.cut$Date <- as.Date(prok.cut$Date)
# DNA Sequencing Costs from NHGRI: http://www.genome.gov/sequencingcosts/
# Data from http://www.genome.gov/pages/der/sequencing_cost.pptx
# After munging the pptx, download the tables from pastebin. Accessed 12:42PST, 2012-12-20
seq.cost <- read.table("http://pastebin.com/raw.php?i=NA6c4i70", header=TRUE)
# Format the date.
seq.cost$Date <- as.Date(seq.cost$Date,format="%m-%d-%Y")
# Draw our plots
library("ggplot2")
library("grid")
library("scales")
(p <- ggplot(prok.cut, aes(Date, Total)) + geom_area() + ggtitle("Bacterial and archeal genome sequences submitted to Genbank") + xlab('Time') + ylab("Total number of genomes")
)
(mb <- ggplot(seq.cost, aes(Date, USD.per.Mb)) + geom_point(colour = "blue") +
stat_smooth(color="#984EA3")+
ggtitle("Cost to sequence one million nucleotides") +
xlab('Time') +
ylab("USD per MB") +
scale_y_continuous(labels = dollar)
)
(genome <- ggplot(seq.cost, aes(Date, USD.per.Genome)) + geom_point(colour = "red") +
stat_smooth(method='lm',color="#FC8D62")+
ggtitle("Cost to sequence one human genome") +
xlab('Time') +
ylab("USD per genome") +
scale_y_log10(labels = dollar)
)
# This part is based on Hadley's Ggplot2 book (doi:10.1007/978-0-387-98141-3_8)
# Save our plot to SVG
library(grDevices)
svg(filename='ncbi-genomes.svg', width = 15, height = 10)
grid.newpage()
pushViewport(viewport(layout = grid.layout(2, 2)))
vplayout <- function(x, y)
viewport(layout.pos.row = x, layout.pos.col = y)
print(p, vp = vplayout(1, 1:2))
print(mb, vp = vplayout(2, 1))
print(genome, vp = vplayout(2, 2))
dev.off()
|
Licensing
I, the copyright holder of this work, hereby publish it under the following licenses:
This file is licensed under the Creative Commons Attribution-Share Alike 3.0 Unported license.
- You are free:
- to share – to copy, distribute and transmit the work
- to remix – to adapt the work
- Under the following conditions:
- attribution – You must give appropriate credit, provide a link to the license, and indicate if changes were made. You may do so in any reasonable manner, but not in any way that suggests the licensor endorses you or your use.
- share alike – If you remix, transform, or build upon the material, you must distribute your contributions under the same or compatible license as the original.

|
Permission is granted to copy, distribute and/or modify this document under the terms of the GNU Free Documentation License, Version 1.2 or any later version published by the Free Software Foundation; with no Invariant Sections, no Front-Cover Texts, and no Back-Cover Texts. A copy of the license is included in the section entitled GNU Free Documentation License. |
You may select the license of your choice.
File history
Click on a date/time to view the file as it appeared at that time.
| Date/Time | Thumbnail | Dimensions | User | Comment | |
|---|---|---|---|---|---|
| current | 06:04, 21 December 2012 | | 1,350 × 900 (145 KB) | wikimediacommons>Estevezj | Added subplot labels. |
File usage
The following page uses this file: