
File:PrimePi.svg

Size of this PNG preview of this SVG file: 505 × 325 pixels. Other resolutions: 320 × 206 pixels | 640 × 412 pixels | 1,024 × 659 pixels | 1,280 × 824 pixels | 2,560 × 1,648 pixels.
Original file (SVG file, nominally 505 × 325 pixels, file size: 26 KB)
| This is a file from the Wikimedia Commons. Information from its description page there is shown below. Commons is a freely licensed media file repository. You can help. |
Summary
| Description |
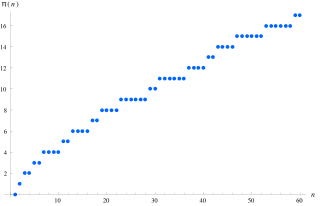
English: The prime counting function plotted from 1 to 60. |
||
| Date | |||
| Source | Mathematica source code | ||
| Author | Bender2k14 | ||
| SVG development | This chart was created with Mathematica.
| ||
| Source code | Mathematica codeListPlot[PrimePi[Range[60]], PlotStyle -> {Hue[.6], PointSize[0.0125]}, AxesLabel -> {Style[n, FontSize -> 12], Style["\[Pi](n)", FontFamily -> "Times", FontSize -> 12, Italic]}, Ticks -> {Automatic, Table[i, {i, 0, 20, 2}]}, ImageSize -> 500]
|
Licensing
I, the copyright holder of this work, hereby publish it under the following licenses:

|
Permission is granted to copy, distribute and/or modify this document under the terms of the GNU Free Documentation License, Version 1.2 or any later version published by the Free Software Foundation; with no Invariant Sections, no Front-Cover Texts, and no Back-Cover Texts. A copy of the license is included in the section entitled GNU Free Documentation License. |
This file is licensed under the Creative Commons Attribution-Share Alike 3.0 Unported license.
- You are free:
- to share – to copy, distribute and transmit the work
- to remix – to adapt the work
- Under the following conditions:
- attribution – You must give appropriate credit, provide a link to the license, and indicate if changes were made. You may do so in any reasonable manner, but not in any way that suggests the licensor endorses you or your use.
- share alike – If you remix, transform, or build upon the material, you must distribute your contributions under the same or compatible license as the original.
You may select the license of your choice.
File history
Click on a date/time to view the file as it appeared at that time.
| Date/Time | Thumbnail | Dimensions | User | Comment | |
|---|---|---|---|---|---|
| current | 20:29, 19 October 2011 | | 505 × 325 (26 KB) | wikimediacommons>Bender2k14 | manually set correct font-family for parentheses |
File usage
The following page uses this file: