
File:Targzip.svg

Size of this PNG preview of this SVG file: 800 × 207 pixels. Other resolutions: 320 × 83 pixels | 640 × 165 pixels | 1,024 × 265 pixels | 1,280 × 331 pixels | 2,560 × 662 pixels | 1,814 × 469 pixels.
Original file (SVG file, nominally 1,814 × 469 pixels, file size: 6 KB)
| This is a file from the Wikimedia Commons. Information from its description page there is shown below. Commons is a freely licensed media file repository. You can help. |
Summary
| Description |
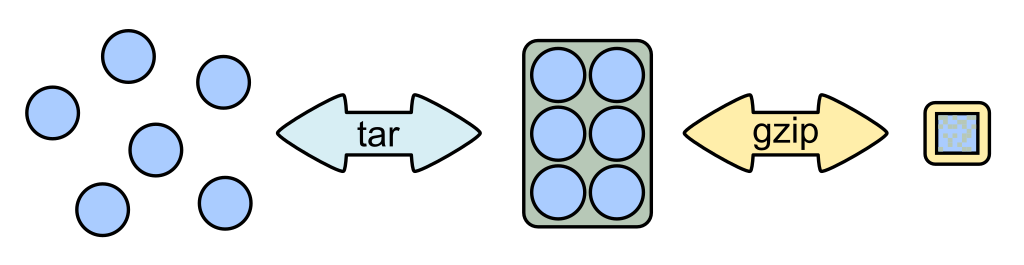
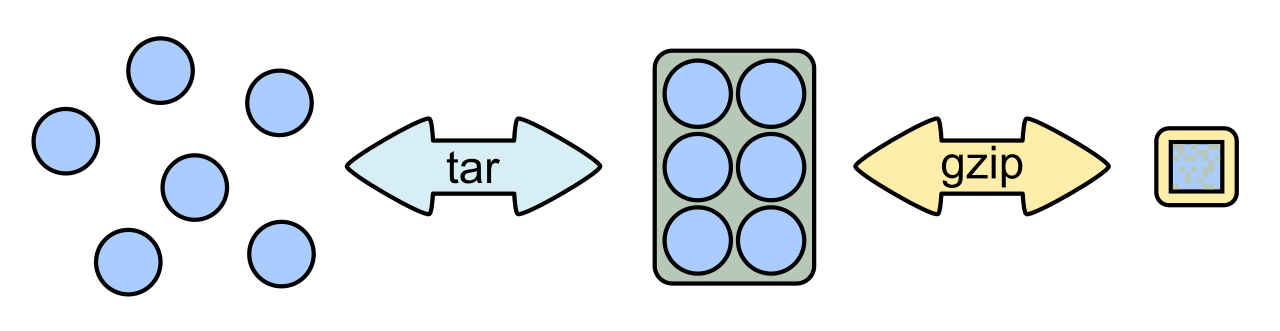
English: Schema of tar-creation and compressing via gzip. In this diagram, the entropy of data corresponds with how much of the data can fit in a square of the same width and height: the more that can fit, the more it has been compressed and the higher the entropy. The files are represented as circles and the gzip stream is represented as a square to show the change in entropy.
The tar container data occupies space equal to the area of the green rectangle (shown in the middle), and the file data occupies space equal to the area to the blue circles. Mathematically, they are in a ratio approximately 25:39, respectively. 64 blocks are shown in the gzip stream: the 25 green blocks are compressed tar container data and the 39 blue blocks are compressed file data. In real-world situations, certain data would be difficult to compress, such as a JPG image, and in the gzip stream, it would consume several times more data than the tar container data as tar data is relatively simple to compress. Other types of data, such as those with unusually long run-lengths, might be easier to compress than tar data.
Esperanto: Skemo de kunigo de dosieroj per tar kaj densigo de la arkivo per gzip
|
| Date | 03.07.2008 |
| Source | Own work |
| Author | Th0msn80 |
| Other versions | Image:Targzip.jpg |
Licensing
I, the copyright holder of this work, hereby publish it under the following license:
This file is licensed under the Creative Commons Attribution 3.0 Unported license.
- You are free:
- to share – to copy, distribute and transmit the work
- to remix – to adapt the work
- Under the following conditions:
- attribution – You must give appropriate credit, provide a link to the license, and indicate if changes were made. You may do so in any reasonable manner, but not in any way that suggests the licensor endorses you or your use.
File history
Click on a date/time to view the file as it appeared at that time.
| Date/Time | Thumbnail | Dimensions | User | Comment | |
|---|---|---|---|---|---|
| current | 18:53, 27 August 2023 | 1,814 × 469 (6 KB) | wikimediacommons>Phreneticc | little compressed |
File usage
The following 3 pages use this file: