
File:Transcriptomes heatmap example.svg

Size of this PNG preview of this SVG file: 454 × 600 pixels. Other resolutions: 182 × 240 pixels | 363 × 480 pixels | 581 × 768 pixels | 775 × 1,024 pixels | 1,550 × 2,048 pixels | 483 × 638 pixels.
Original file (SVG file, nominally 483 × 638 pixels, file size: 502 KB)
| This is a file from the Wikimedia Commons. Information from its description page there is shown below. Commons is a freely licensed media file repository. You can help. |
Summary
| Description |
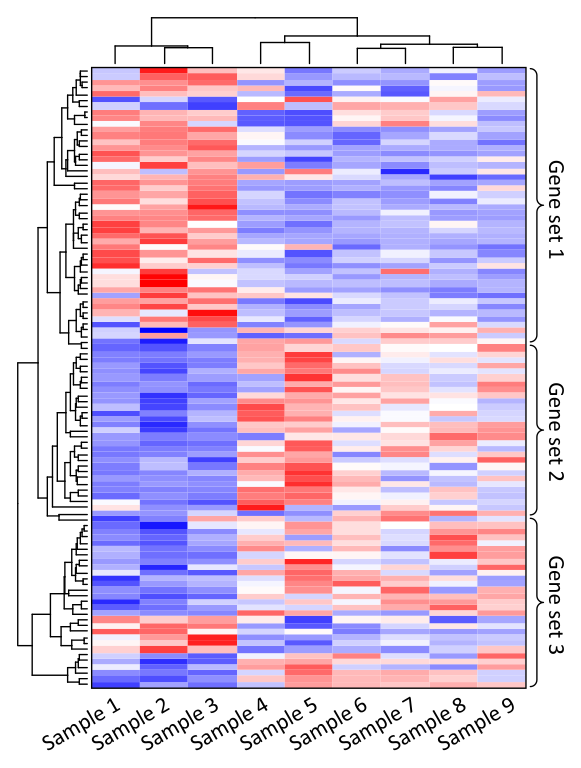
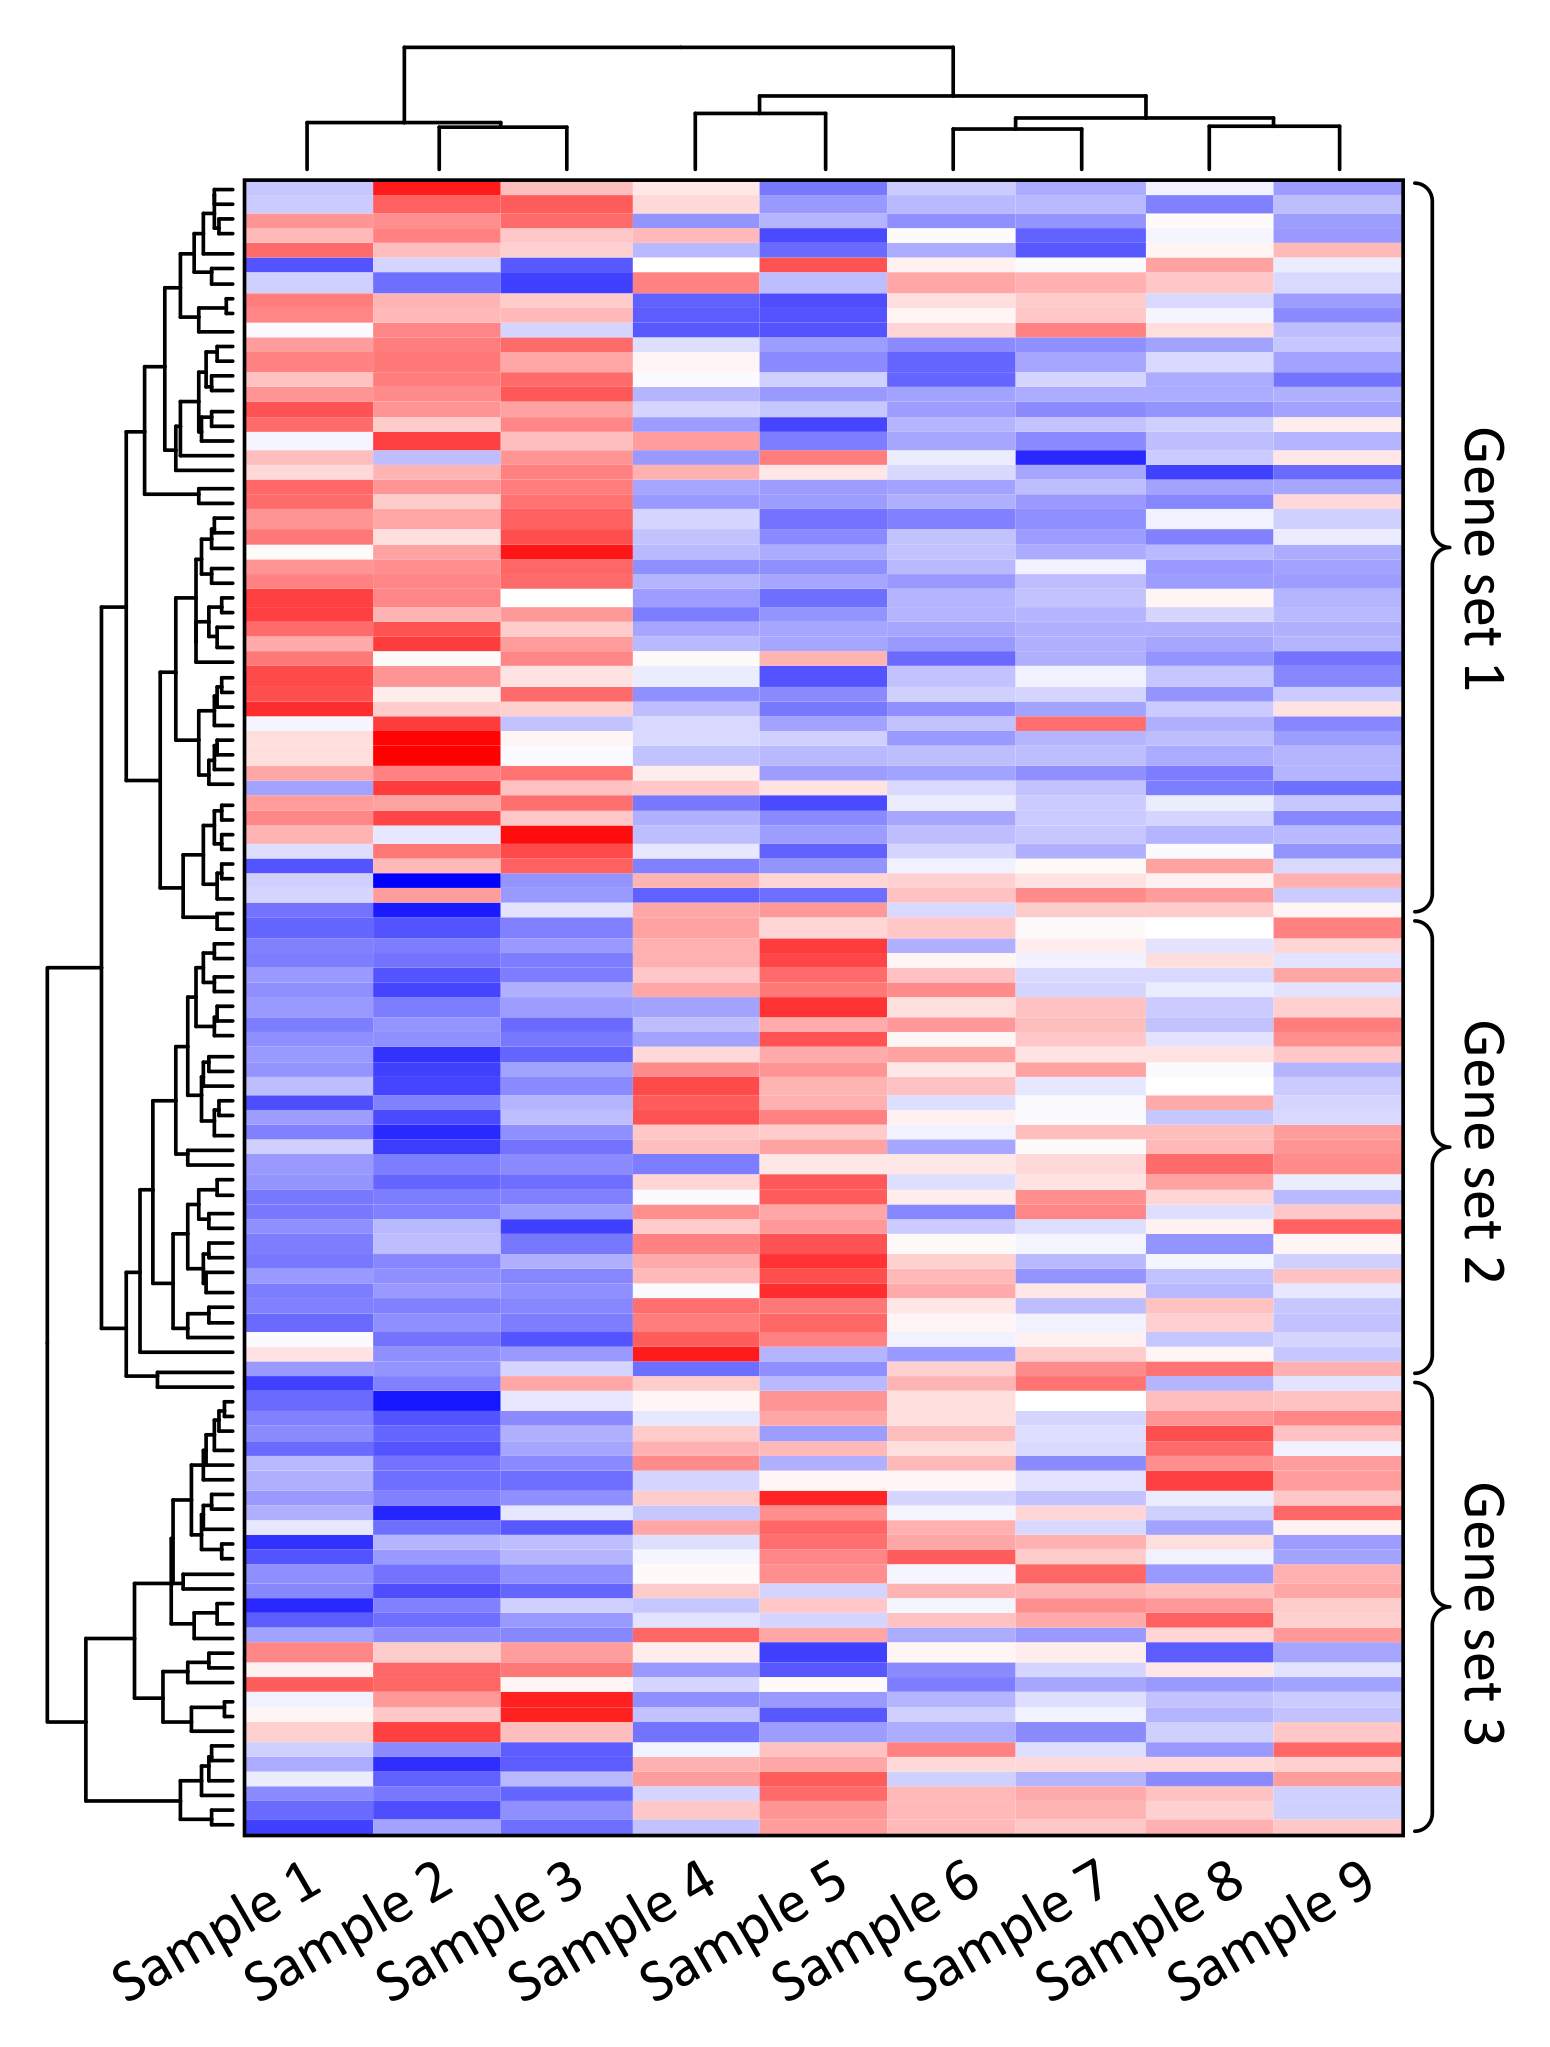
English: Heatmap identification of gene co-expression patterns across different samples. Each column contains the measurements for gene expression change for a single sample. Relative gene expression is indicated by colour: high-expression (red), median-expression (white) and low-expression (blue). Genes and samples with similar expression profiles can be automatically grouped (left and top trees). Samples may be different individuals, tissues, environments or health conditions. In this example, expression of gene set 1 is high and gene set 2 is low in samples 1, 2, and 3. |
| Date | |
| Source | Own work |
| Author | Thomas Shafee |
Licensing
I, the copyright holder of this work, hereby publish it under the following license:
This file is licensed under the Creative Commons Attribution 4.0 International license.
- You are free:
- to share – to copy, distribute and transmit the work
- to remix – to adapt the work
- Under the following conditions:
- attribution – You must give appropriate credit, provide a link to the license, and indicate if changes were made. You may do so in any reasonable manner, but not in any way that suggests the licensor endorses you or your use.
File history
Click on a date/time to view the file as it appeared at that time.
| Date/Time | Thumbnail | Dimensions | User | Comment | |
|---|---|---|---|---|---|
| current | 03:38, 10 March 2017 | | 483 × 638 (502 KB) | wikimediacommons>Evolution and evolvability | slight line edits |
File usage
The following page uses this file: