Portal:Geography/Selected picture
The Selected picture box on the portal chooses one of the following at random when displaying the page. Follow the instructions below for adding or nominating a new picture to the list.
Picture candidates
Feel free to add related featured pictures to the list. Nominate other pictures on the portal talk page.
- Pictures must be
- Free to use and hosted on Commons
- Of good quality (not blurred, grainy or discoloured)
- Interesting
- Relevant to an article or topic
To find appropriate pictures, use search box below: <inputbox> type=search default=Portal:Geography/Selected picture namespaces=Template prefix=Template:POTD/ arialabel=Search picture of the day searchbuttonlabel=Search POTDs break=no </inputbox>
Instructions
- For pictures, which appeared as picture of the day on the Main Page, just add the date in
YYYY-MM-DDformat to the list (please keep the list sorted). - For other pictures, use following parameters:
|iN=
|titleN=
|creditN=
|captionN=
where N is the next unused number.
Selected pictures list
-
 Map: Strebe, using GeocartThe Robinson projection is a map projection of a world map which shows the entire world at once. It was devised by Arthur H. Robinson in 1963 in response to an appeal from the Rand McNally company for a good compromise to the problem of readily showing the whole globe as a flat image. The company has used the projection since that time, and the National Geographic Society used the Robinson from 1988 to 1998.
 -
 Photograph: Maull & Fox; restoration: Adam CuerdenFanny Bullock Workman (1859–1925) was an American geographer, cartographer, explorer, travel writer, and mountaineer. Together with her husband, William Hunter Workman, she traveled by bicycle through Switzerland, France, Italy, Spain, Algeria and India; after taking up climbing in the Himalayas, she set a women's altitude record on Pinnacle Peak, reaching 23,000 feet (7,000 m). She published eight travel books, with particular focus on the lives of women in the countries she visited, and championed women's rights and women's suffrage.
 -
 Image: Chris RywaltAn animation showing the unfolding of a Dymaxion map, a projection of a world map onto the surface of a polyhedron (in this case, an icosahedron) and then flattened to form a two-dimensional map which retains most of the relative proportional integrity of the globe map. This type of map was invented by Buckminster Fuller and is one of several of his inventions to use the name Dymaxion.
 -
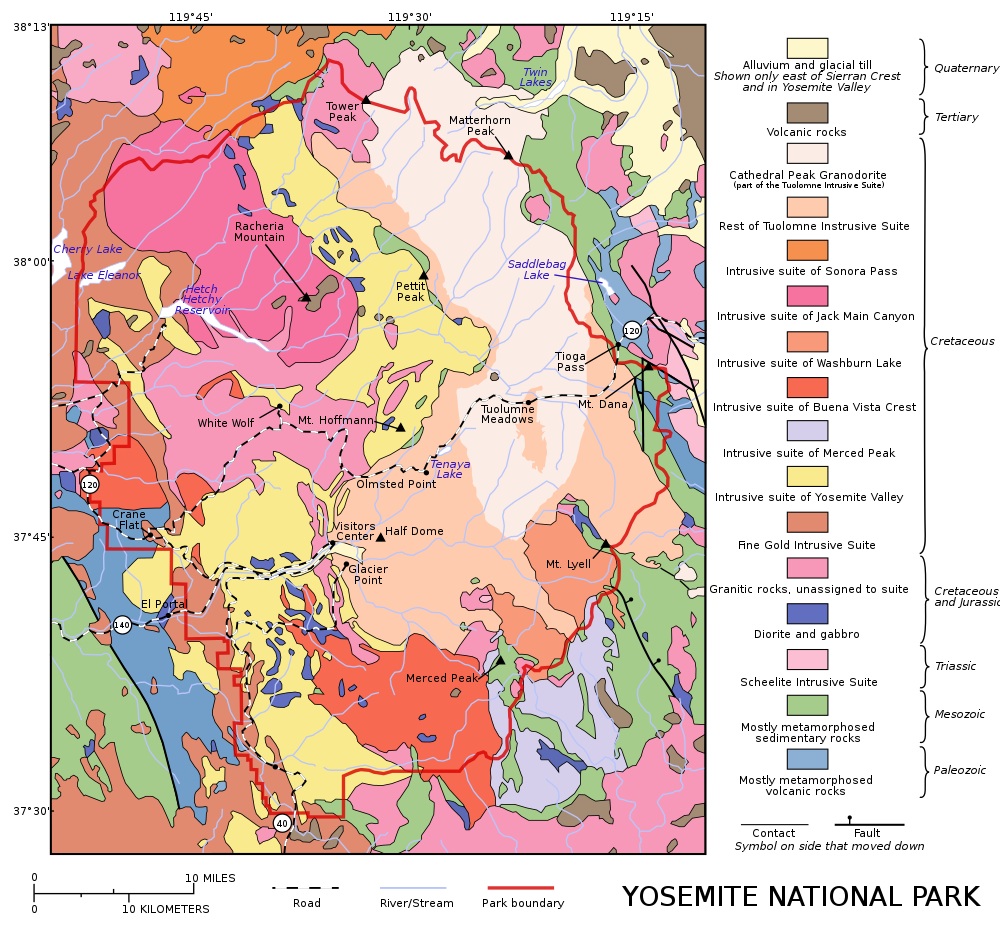
 Map: Grandiose, based on a map by the United States Geological SurveyA geological map of Yosemite National Park (full size), showing the Cathedral Peak Granodiorite, the largest unit in the Tuolumne Intrusive Suite, which in turn is the largest granitic suite in the park.
Cathedral Peak Granodiorite
Rest of the Tuolumne Intrusive Suite -
 Map: Strebe, using the Geocart map projection softwareA two-point equidistant projection of Eurasia. All distances of other points from the two points marked in red (45°N 40°E and 30°N 110°E) are correct. This map is a derivative of NASA's Blue Marble summer month composite, with oceans lightened to enhance legibility and contrast.
 -
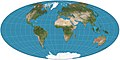
 Map credit: Central Intelligence AgencyThe Robinson projection is a projection of a world map showing the entire Earth at once. It was specifically created in an attempt to find a good compromise to the problem of showing the whole globe as a single flat image. The projection was devised by Arthur H. Robinson in 1963; distortion is severe close to the poles, but quickly declines to moderate levels as latitudes decrease. This Robinson-projection map, with standard parallels of 38°N and 38°S, was produced by the United States Central Intelligence Agency and shows the world as of February 2016.
 -
 Map: Strebe, using GeocartThe Eckert II projection is an equal-area pseudocylindrical map projection presented by Max Eckert-Greifendorff in 1906. In the equatorial aspect (where the equator is shown as the horizontal axis) the network of longitude and latitude lines consists solely of straight lines, and the outer boundary has the distinctive shape of an elongated hexagon.
 -
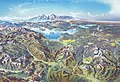 Map credit: Heinrich C. BerannYellowstone National Park is an American national park located mostly in Wyoming and extending into Montana and Idaho. It was established by the U.S. Congress and signed into law by President Ulysses S. Grant on March 1, 1872. Yellowstone was the first national park in the U.S. and is also widely held to be the first national park in the world. The park is known for its wildlife and its many geothermal features, especially the Old Faithful geyser, one of its most popular landmarks. It has many types of ecosystems, but the subalpine forest is the most abundant. The park is part of the South Central Rockies forests ecoregion. In 1978, Yellowstone was named a World Heritage Site by UNESCO.
This picture is a stylized panoramic map of Yellowstone National Park as viewed from the northeast, created in 1991 by Austrian painter and cartographer Heinrich C. Berann for the National Park Service. Yellowstone Lake and the Grand Canyon of the Yellowstone are in the center, while Old Faithful is visible on the right, next to a brown building representing the Old Faithful Inn. Jackson Lake and the peaks of the Teton Range are depicted in the background. -
 Daedongyeojido is a large scale map of Korea produced by Chosun Dynasty cartographer and geologist Kim Jeong-ho in 1861. Considered to mark the zenith of pre-modern Korean cartography, the map consists of 22 separate, foldable booklets, each covering approximately 47 kilometres (29 mi) (north-south) by 31.5 kilometres (19.6 mi) (east-west). Combined, they form a map of Korea that is 6.7 metres (22 ft) wide and 3.8 metres (12 ft) long. Daedongyeojido is praised for precise delineations of mountain ridges, waterways, and transportation routes, as well as its markings for settlements, administrative areas, and cultural sites.
 -
 Map: Strebe, using GeocartThe Mercator projection is a cylindrical map projection presented by the Flemish geographer and cartographer Gerardus Mercator in 1569. Because it represents paths of constant course as straight lines, it long served as the standard map projection for nautical purposes. However, it distorts the size of objects as the latitude increases: thus areas in the mid-latitudes appear significantly larger than their actual size relative to those the equator, and those near the poles are even more exaggerated. Most modern atlases no longer use the Mercator projection for world maps or for areas distant from the equator, preferring other cylindrical projections, or forms of equal-area projection.
 -
 Map: Jorge de AguiarA portolan chart from 1492, the oldest known signed and dated chart of Portuguese origin. Cartography technologies greatly advanced during the Age of Discovery. Iberian mapmakers in particular focused on practical charts to use as navigational aids. Unlike Spanish maps which were regarded as state secrets, Portuguese ones were used by other countries, and Portuguese cartographers drew upon the skill and knowledge of other cultures as well.
 -
 Map: Strebe, using GeocartThe Aitoff projection is a modified azimuthal map projection first proposed by David A. Aitoff in 1889. Based on the equatorial form of the azimuthal equidistant projection, Aitoff halved longitudes from the central meridian, projected by the azimuthal equidistant, and then stretched the result horizontally into a 2:1 ellipse.
 -
 Map: Strebe, using GeocartThe Gall–Peters projection, named after James Gall and Arno Peters, is a specialization of a configurable equal-area map projection known as the cylindrical equal-area projection. It achieved considerable notoriety in the late 20th century as the centerpiece of a controversy surrounding the political implications of map design; Peters promoted it as a more faithful representation than the Mercator projection, which inflates the sizes of regions farther from the equator and thus makes the (mostly technologically underdeveloped) equatorial countries appear smaller and therefore, according to Peters, less significant.
 -
 A map showing the geography of Florida, a state in the United States. Situated on a peninsula between the Gulf of Mexico, the Atlantic Ocean, and the Straits of Florida, Florida has an extensive coastline. Its highest point, Britton Hill, is the lowest highpoint of any U.S. state. Florida is home to over 19 million people, living in 410 municipalities.
 -
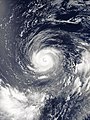 Typhoon Noru was the second-longest lasting tropical cyclone of the northwest Pacific Ocean on record. The fifth named storm of the 2017 Pacific typhoon season, it formed on July 19 and reached peak intensity on July 31 with 175 km/h (110 mph) 10-minute sustained winds. By this time, as shown in this satellite image, the typhoon was located south of Iwo Jima, and had taken on annular characteristics, with a symmetric ring of deep convection surrounding a 30 km (19 mi) well defined eye and fairly uniform cloud top temperatures. Traveling northwestward over an area of low ocean heat content, the eye became enlarged and ragged as the system weakened. By the time Noru made landfall over Wakayama Prefecture, Japan, on August 7, it had been downgraded to a severe tropical storm. It then dissipated over the Sea of Japan on August 9 as an extratropical cyclone.


