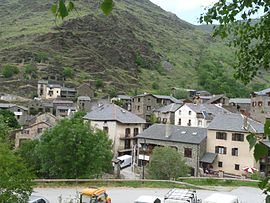
Valcebollère
Commune in Occitania, France
Valcebollère (French pronunciation: [valsəbɔjɛʁ] ; Catalan: Vallsabollera) is a commune in the Pyrénées-Orientales department in southern France.
Valcebollère
Vallcebollera | |
|---|---|
 A general view of Valcebollère | |
| Coordinates: 42°23′18″N 2°02′09″E / 42.3883°N 2.0358°E | |
| Country | France |
| Region | Occitania |
| Department | Pyrénées-Orientales |
| Arrondissement | Prades |
| Canton | Les Pyrénées catalanes |
| Intercommunality | Pyrénées Cerdagne |
| Government | |
| • Mayor (2020–2026) | Jean-Claude Ribelaygue[1] |
| Area 1 | 26.03 km2 (10.05 sq mi) |
| Time zone | UTC+01:00 (CET) |
| • Summer (DST) | UTC+02:00 (CEST) |
| INSEE/Postal code | 66220 /66340 |
| Elevation | 1,339–2,661 m (4,393–8,730 ft) (avg. 1,247 m or 4,091 ft) |
| 1 French Land Register data, which excludes lakes, ponds, glaciers > 1 km2 (0.386 sq mi or 247 acres) and river estuaries. | |
Geography
Valcebollère is located in the canton of Les Pyrénées catalanes and in the arrondissement of Prades.
Population
<graph>{"legends":[],"scales":[{"type":"linear","name":"x","zero":false,"domain":{"data":"chart","field":"x"},"range":"width","nice":true},{"clamp":true,"type":"linear","name":"y","domain":{"data":"chart","field":"y"},"domainMin":0,"zero":false,"range":"height","nice":true},{"domain":{"data":"chart","field":"series"},"type":"ordinal","name":"color","range":"category10"}],"version":2,"marks":[{"type":"line","properties":{"hover":{"stroke":{"value":"red"}},"update":{"stroke":{"scale":"color","field":"series"}},"enter":{"y":{"scale":"y","field":"y"},"x":{"scale":"x","field":"x"},"stroke":{"scale":"color","field":"series"},"strokeWidth":{"value":2.5}}},"from":{"data":"chart"}}],"height":170,"axes":[{"type":"x","title":"Year","scale":"x","format":"d","properties":{"title":{"fill":{"value":"#54595d"}},"grid":{"stroke":{"value":"#54595d"}},"ticks":{"stroke":{"value":"#54595d"}},"axis":{"strokeWidth":{"value":2},"stroke":{"value":"#54595d"}},"labels":{"align":{"value":"right"},"angle":{"value":-45},"fill":{"value":"#54595d"}}},"grid":false},{"type":"y","title":"Population","scale":"y","format":",d","properties":{"title":{"fill":{"value":"#54595d"}},"grid":{"stroke":{"value":"#54595d"}},"ticks":{"stroke":{"value":"#54595d"}},"axis":{"strokeWidth":{"value":2},"stroke":{"value":"#54595d"}},"labels":{"fill":{"value":"#54595d"}}},"grid":true}],"data":[{"format":{"parse":{"y":"integer","x":"integer"},"type":"json"},"name":"chart","values":[{"y":26,"series":"y","x":1968},{"y":23,"series":"y","x":1975},{"y":25,"series":"y","x":1982},{"y":37,"series":"y","x":1990},{"y":49,"series":"y","x":1999},{"y":39,"series":"y","x":2007},{"y":47,"series":"y","x":2012},{"y":42,"series":"y","x":2017}]}],"width":170}</graph>
| Year | Pop. | ±% p.a. |
|---|---|---|
| 1968 | 26 | — |
| 1975 | 23 | −1.74% |
| 1982 | 25 | +1.20% |
| 1990 | 37 | +5.02% |
| 1999 | 49 | +3.17% |
| 2007 | 39 | −2.81% |
| 2012 | 47 | +3.80% |
| 2017 | 42 | −2.22% |
| Source: INSEE[2] | ||
See also
References
- ^ "Répertoire national des élus: les maires" (in français). data.gouv.fr, Plateforme ouverte des données publiques françaises. 13 September 2022.
- ^ Population en historique depuis 1968, INSEE
Wikimedia Commons has media related to Valcebollère.

