File:Modified version of Fig 2 of Cano et al 2022.pdf
The media handler extension for this file format is missing. Advanced media features may not work unless the file is viewed at Wikimedia Commons.

Size of this preview: 800 × 268 pixels. Other resolutions: 320 × 107 pixels | 640 × 214 pixels | 1,024 × 343 pixels | 2,614 × 875 pixels.
Original file (file size: 161 KB, MIME type: application/pdf)
| This is a file from the Wikimedia Commons. Information from its description page there is shown below. Commons is a freely licensed media file repository. You can help. |
Summary
| Description |
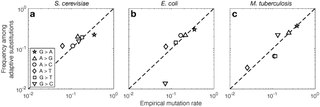
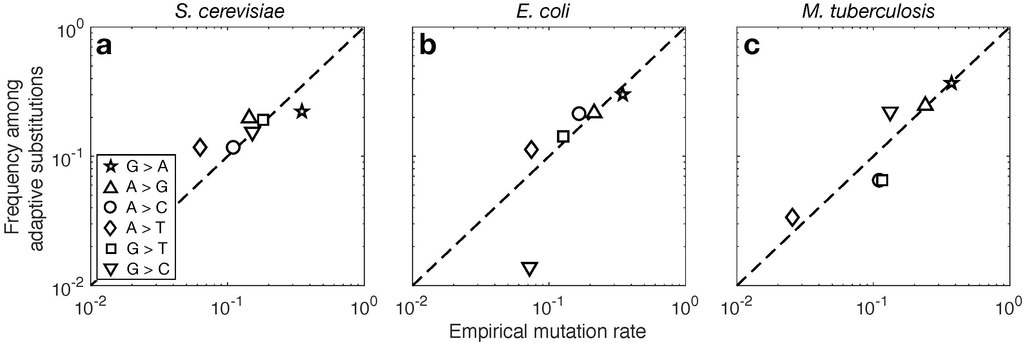
English: The frequency of nucleotide changes among adaptive substitutions is plotted as a function of the empirical mutation rate for (a) S. cerevisiae, (b) E. coli, and (c) M. tuberculosis. The symbols correspond to the six different types of point mutations (inset in panel a). |
| Date | |
| Source | Own work |
| Author | Alejvcano |
Licensing
I, the copyright holder of this work, hereby publish it under the following license:
This file is licensed under the Creative Commons Attribution-Share Alike 4.0 International license.
- You are free:
- to share – to copy, distribute and transmit the work
- to remix – to adapt the work
- Under the following conditions:
- attribution – You must give appropriate credit, provide a link to the license, and indicate if changes were made. You may do so in any reasonable manner, but not in any way that suggests the licensor endorses you or your use.
- share alike – If you remix, transform, or build upon the material, you must distribute your contributions under the same or compatible license as the original.

|
This media file is uncategorized.
Please help improve this media file by adding it to one or more categories, so it may be associated with related media files (how?), and so that it can be more easily found.
Please notify the uploader with {{subst:Please link images|File:Modified version of Fig 2 of Cano et al 2022.pdf}} ~~~~ |
File history
Click on a date/time to view the file as it appeared at that time.
| Date/Time | Thumbnail | Dimensions | User | Comment | |
|---|---|---|---|---|---|
| current | 15:00, 12 January 2023 | (161 KB) | wikimediacommons>Alejvcano | Uploaded own work with UploadWizard |
File usage
The following page uses this file: