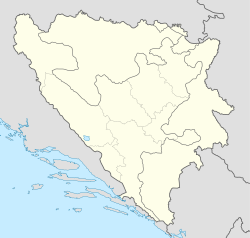
Komrani
Komrani | |
|---|---|
Village | |
| Coordinates: 43°44′N 18°47′E / 43.733°N 18.783°E | |
| Country | Bosnia and Herzegovina |
| Entity | Federation of Bosnia and Herzegovina |
| Canton | Bosnian-Podrinje Goražde |
| Municipality | Pale-Prača |
| Area | |
| • Total | 2.55 sq mi (6.61 km2) |
| Population (2013) | |
| • Total | 20 |
| • Density | 7.8/sq mi (3.0/km2) |
| Time zone | UTC+1 (CET) |
| • Summer (DST) | UTC+2 (CEST) |
Komrani is a village in the municipality of Pale-Prača, Bosnia and Herzegovina.[1] According to the 2013 census, the village has a population of 20.[2]
Demographics
Historical evolution of the population in the settlement
| Year | 1961 | 1971 | 1981 | 1991 | 2013 |
|---|---|---|---|---|---|
| Population | 169 | 154 | 135 | 109[3] | 20 |
| Evolution of the population |
| <graph>{"legends":[],"scales":[{"type":"linear","name":"x","zero":false,"domain":{"data":"chart","field":"x"},"range":"width","nice":true},{"type":"linear","name":"y","domain":{"data":"chart","field":"y"},"zero":false,"range":"height","nice":true},{"domain":{"data":"chart","field":"series"},"type":"ordinal","name":"color","range":"category10"}],"version":2,"marks":[{"type":"line","properties":{"hover":{"stroke":{"value":"red"}},"update":{"stroke":{"scale":"color","field":"series"}},"enter":{"y":{"scale":"y","field":"y"},"x":{"scale":"x","field":"x"},"stroke":{"scale":"color","field":"series"},"strokeWidth":{"value":2.5}}},"from":{"data":"chart"}},{"type":"symbol","properties":{"enter":{"y":{"scale":"y","field":"y"},"x":{"scale":"x","field":"x"},"size":{"value":50},"fill":{"scale":"color","field":"series"},"stroke":{"scale":"color","field":"series"},"shape":{"value":"circle"},"strokeWidth":{"value":0}}},"from":{"data":"chart"}}],"height":250,"axes":[{"type":"x","scale":"x","format":"d","properties":{"title":{"fill":{"value":"#54595d"}},"grid":{"stroke":{"value":"#54595d"}},"ticks":{"stroke":{"value":"#54595d"}},"axis":{"strokeWidth":{"value":2},"stroke":{"value":"#54595d"}},"labels":{"align":{"value":"right"},"angle":{"value":-40},"fill":{"value":"#54595d"}}},"grid":false},{"type":"y","title":"Population","scale":"y","format":"d","properties":{"title":{"fill":{"value":"#54595d"}},"grid":{"stroke":{"value":"#54595d"}},"ticks":{"stroke":{"value":"#54595d"}},"axis":{"strokeWidth":{"value":2},"stroke":{"value":"#54595d"}},"labels":{"fill":{"value":"#54595d"}}},"grid":true}],"data":[{"format":{"parse":{"y":"integer","x":"integer"},"type":"json"},"name":"chart","values":[{"y":169,"series":"y","x":1961},{"y":154,"series":"y","x":1971},{"y":135,"series":"y","x":1981},{"y":109,"series":"y","x":1991},{"y":20,"series":"y","x":2013}]}],"width":300}</graph> |
Distribution of the population by nationalities (1991)
| Nationality | Number | '%' |
| Muslims | 99 | 90.83 |
| Serbs | 10 | 9.17 |
References
- ^ Official results from the book: Ethnic composition of Bosnia-Herzegovina population, by municipalities and settlements, 1991. census, Zavod za statistiku Bosne i Hercegovine - Bilten no.234, Sarajevo 1991.
- ^ Population by ethnicity and gender, by settlements
- ^ "Population 1961-1991" (in bosanski).
