Nyer
Nyer | |
|---|---|
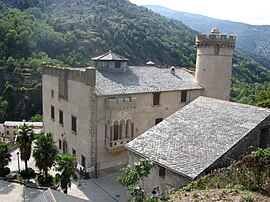
 The château in Nyer | |
| Coordinates: 42°32′04″N 2°16′36″E / 42.5344°N 2.2767°E | |
| Country | France |
| Region | Occitania |
| Department | Pyrénées-Orientales |
| Arrondissement | Prades |
| Canton | Les Pyrénées catalanes |
| Government | |
| • Mayor (2020–2026) | André Argilès[1] |
| Area 1 | 37.00 km2 (14.29 sq mi) |
| Time zone | UTC+01:00 (CET) |
| • Summer (DST) | UTC+02:00 (CEST) |
| INSEE/Postal code | 66123 /66360 |
| Elevation | 656–2,645 m (2,152–8,678 ft) (avg. 734 m or 2,408 ft) |
| 1 French Land Register data, which excludes lakes, ponds, glaciers > 1 km2 (0.386 sq mi or 247 acres) and river estuaries. | |
Nyer (French pronunciation: [ɲɛʁ] ; Catalan: Nyer) is a commune in the Pyrénées-Orientales department in southern France.
Geography
Nyer is located in the canton of Les Pyrénées catalanes and in the arrondissement of Prades. Nyer station and Thuès-les-Bains station have rail connections to Villefranche-de-Conflent and Latour-de-Carol.

Population
<graph>{"legends":[],"scales":[{"type":"linear","name":"x","zero":false,"domain":{"data":"chart","field":"x"},"range":"width","nice":true},{"clamp":true,"type":"linear","name":"y","domain":{"data":"chart","field":"y"},"domainMin":0,"zero":false,"range":"height","nice":true},{"domain":{"data":"chart","field":"series"},"type":"ordinal","name":"color","range":"category10"}],"version":2,"marks":[{"type":"line","properties":{"hover":{"stroke":{"value":"red"}},"update":{"stroke":{"scale":"color","field":"series"}},"enter":{"y":{"scale":"y","field":"y"},"x":{"scale":"x","field":"x"},"stroke":{"scale":"color","field":"series"},"strokeWidth":{"value":2.5}}},"from":{"data":"chart"}}],"height":170,"axes":[{"type":"x","title":"Year","scale":"x","format":"d","properties":{"title":{"fill":{"value":"#54595d"}},"grid":{"stroke":{"value":"#54595d"}},"ticks":{"stroke":{"value":"#54595d"}},"axis":{"strokeWidth":{"value":2},"stroke":{"value":"#54595d"}},"labels":{"align":{"value":"right"},"angle":{"value":-45},"fill":{"value":"#54595d"}}},"grid":false},{"type":"y","title":"Population","scale":"y","format":",d","properties":{"title":{"fill":{"value":"#54595d"}},"grid":{"stroke":{"value":"#54595d"}},"ticks":{"stroke":{"value":"#54595d"}},"axis":{"strokeWidth":{"value":2},"stroke":{"value":"#54595d"}},"labels":{"fill":{"value":"#54595d"}}},"grid":true}],"data":[{"format":{"parse":{"y":"integer","x":"integer"},"type":"json"},"name":"chart","values":[{"y":137,"series":"y","x":1968},{"y":112,"series":"y","x":1975},{"y":140,"series":"y","x":1982},{"y":132,"series":"y","x":1990},{"y":108,"series":"y","x":1999},{"y":178,"series":"y","x":2007},{"y":160,"series":"y","x":2012},{"y":148,"series":"y","x":2017}]}],"width":170}</graph>
| Year | Pop. | ±% p.a. |
|---|---|---|
| 1968 | 137 | — |
| 1975 | 112 | −2.84% |
| 1982 | 140 | +3.24% |
| 1990 | 132 | −0.73% |
| 1999 | 108 | −2.21% |
| 2007 | 178 | +6.44% |
| 2012 | 160 | −2.11% |
| 2017 | 148 | −1.55% |
| Source: INSEE[2] | ||
See also
References
- ^ "Répertoire national des élus: les maires". data.gouv.fr, Plateforme ouverte des données publiques françaises (in français). 2 December 2020.
- ^ Population en historique depuis 1968, INSEE
Wikimedia Commons has media related to Nyer.
Categories:
- CS1 français-language sources (fr)
- Short description with empty Wikidata description
- Coordinates not on Wikidata
- Pages with French IPA
- Articles containing Catalan-language text
- Pages using Lang-xx templates
- Commons category link is the pagename
- Communes of Pyrénées-Orientales
- Pyrénées-Orientales geography stubs


